
If you're trying to diagnose a slow VM, standard CPU and RAM graphs usually aren't enough. The most useful VM monitoring metrics are CPU ready time, CPU usage, memory ballooning, swap activity, disk latency, IOPS, throughput, and network packet loss or latency. Together, they tell you whether the real problem is host contention, memory pressure, storage delay, or network trouble rather than the guest OS alone.
To follow along, you'll want a basic understanding of what is a virtual machine, how virtualization works and access to either your hypervisor dashboard or guest tools like top, htop, iostat, vmstat, or Windows PerfMon. That's the big gotcha here: VM monitoring is not the same as bare-metal monitoring.
What are VM monitoring metrics?
VM monitoring metrics are the measurements you use to understand how a virtual machine is behaving across CPU, memory, disk, network, and the virtualization layer itself. Some come from inside the guest OS. Others only show up at the hypervisor or host level in VMware, Hyper-V, KVM, Proxmox, or similar platforms.
That extra layer changes everything. On a physical server, if CPU is maxed out, the operating system usually sees it directly. On a VM, the guest might report only moderate CPU usage while the hypervisor scheduler is making that VM wait for time on a physical CPU. I've seen this exact thing in production — users complain the app is lagging, the Linux guest looks fine, and the actual culprit is host contention.
So when people search for vm monitoring metrics or virtual machine monitoring metrics, what they usually need isn't a dictionary. They need a diagnostic map.
- CPU metrics: CPU usage, CPU demand, CPU ready time, co-stop, steal time
- Memory metrics: active memory, consumed memory, ballooning, swap in, swap out, page faults
- Disk metrics: latency, IOPS, throughput, queue depth, datastore latency
- Network metrics: latency, throughput, packet loss, jitter, retransmissions
- Hypervisor signals: host contention, overcommitment, memory reclamation, noisy-neighbor effects
The three metrics that confuse people most and matter a lot are CPU ready time, disk latency, and memory ballooning. We'll spend real time on those, because they're often the difference between guessing and actually fixing the issue.
And if you're still sorting out concepts like VM vs VPS differences keep in mind that the monitoring approach overlaps, but your visibility can vary a lot depending on what your provider exposes.
What makes VM monitoring different from server monitoring?
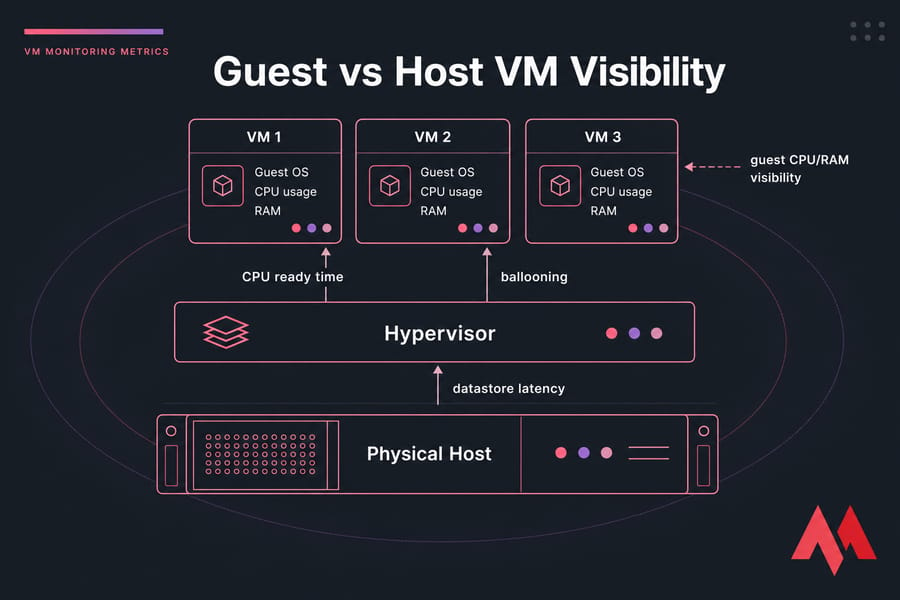
A VM doesn't run directly on hardware. It runs on virtual hardware presented by a hypervisor, and that means the guest OS only sees part of the picture. The host sees scheduling delays, datastore queueing, memory reclamation, and overcommitment. The guest usually doesn't.
Which metrics are symptoms and which are root-cause indicators?
This distinction matters. High application response time is a symptom. High guest CPU can be a symptom too. But CPU ready time, datastore latency, or ballooning are often much closer to the cause. If you mix those up, you'll chase the wrong fix.
Why virtualization adds extra layers of performance data
You've got the guest OS, the VM configuration, the hypervisor scheduler, the physical host, and usually shared storage or a virtual switch. More layers means more places for contention. It also means more opportunities to narrow things down if you're reading the right metrics.
Guest vs host metrics: why VM performance can be misleading
The guest OS only knows about the virtual resources it was given. It sees vCPUs, assigned memory, virtual disks, and virtual NICs. It does not see the full state of the hypervisor scheduler, host memory pressure, or what the neighboring VMs are doing.
That doesn't make guest metrics useless far from it. It just means they need context.
If you want to understand what is a hypervisor, this is one of its biggest effects: it inserts a resource scheduling layer between your operating system and the physical machine.
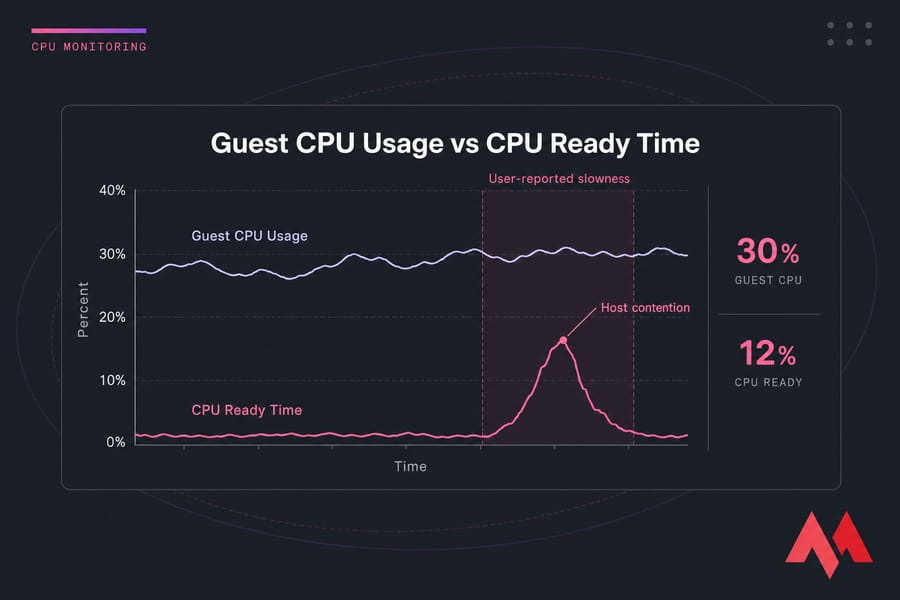
Here's a classic example. A VM feels slow. Inside Linux, CPU usage is only 30%. Nothing looks alarming in top. But in the hypervisor, CPU ready time is elevated because the vCPU is waiting to be scheduled on a busy host. The guest says, "I'm only using 30%." The host says, "Sure, but you're waiting in line."
Same story with memory. The guest may show some free memory and not look desperate, but the host could already be reclaiming memory through ballooning. Or the datastore may be queueing disk I/O even though disk usage inside the guest doesn't look wild. That's why guest vs host metrics should be correlated in the same time window, not treated as separate stories.
| Metric Layer | What You See | What You Miss | Best Use |
|---|---|---|---|
| Guest OS CPU | Process utilization, load, run queue | Scheduler wait on host | Find busy apps and threads |
| Guest OS Memory | Used/free RAM, page faults, guest swap | Host reclamation and ballooning pressure | Spot in-guest memory demand |
| Guest OS Disk | Filesystem usage, local I/O activity | Datastore contention and hypervisor queueing | See when workloads are issuing I/O |
| Guest OS Network | Bandwidth, retransmits, socket errors | Virtual switch congestion, host path issues | Check application-facing traffic behavior |
| Hypervisor CPU | Ready time, co-stop, host contention | Application process detail | Detect vCPU scheduling problems |
| Hypervisor Memory | Ballooning, compression, host swap | App heap detail inside guest | Detect overcommitment and reclaim |
| Hypervisor Storage | Datastore latency, queue depth, service time | Per-process file handles | Find shared storage bottlenecks |
| Hypervisor Network | vSwitch congestion, uplink saturation | App transaction context | Detect shared network contention |
My rule of thumb is simple: trust guest metrics for workload behavior, trust host metrics for virtualization behavior. You need both if performance is weird.
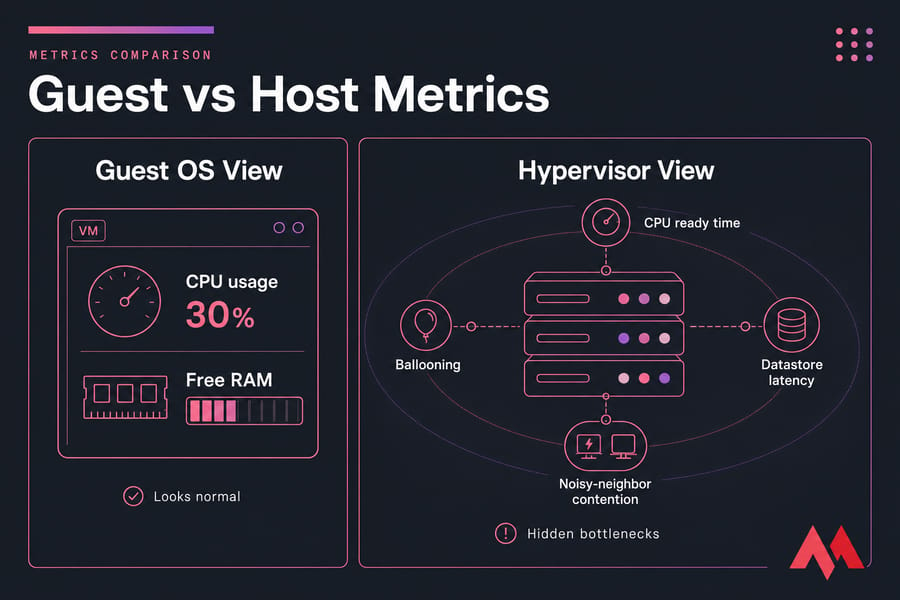
Why guest CPU and RAM usage do not show the full picture
Because they don't include wait time caused by oversubscription, scheduling delays, or memory reclamation outside the guest. A VM can look calm internally and still perform badly.
Hypervisor-level visibility vs in-guest visibility
Hypervisor monitoring shows things the guest can't see: CPU ready, co-stop, datastore latency, balloon driver activity, and host contention. That's the layer where "mystery slowness" often becomes obvious.
When to trust guest metrics and when to escalate to host metrics
If the guest shows a runaway process, memory leak, or obvious I/O storm, start there. But if users report slowness and the guest graphs look oddly normal, escalate quickly to host-level metrics. That's usually where the explanation lives.
CPU monitoring metrics: CPU usage, CPU ready time, co-stop, and steal time
CPU is usually the first place people look, and honestly, that's fine. But you need to look at the right CPU metrics. Guest CPU usage alone won't tell you whether your VM is actually getting CPU time when it needs it.
The four CPU signals that matter most in virtual environments are:
- CPU usage: how much CPU the guest is actively consuming
- CPU demand: how much CPU the VM wants, whether or not it gets it
- CPU ready time: time a vCPU is ready to run but waiting for a physical CPU
- Co-stop / steal time: scheduling side effects in multi-vCPU or shared-host setups
What is CPU ready time?
CPU ready time is the amount of time a VM's vCPU is ready to run but has to wait for access to a physical CPU core, or pCPU. In VMware, this is one of the most useful indicators of CPU contention. In plain English: your VM wants CPU, but the host can't schedule it right away.
That's why CPU ready time is not the same as CPU utilization. Utilization tells you how busy the guest was while it was actually running. Ready time tells you how long it sat in line.
If you've ever had a VM feel sticky, sluggish, or oddly delayed while the guest CPU graph looked tame, this is probably why. The application isn't necessarily CPU-hungry. It's CPU-starved by the host scheduler.
What CPU ready percentage is too high?
Thresholds vary by platform and sampling method, so don't tattoo a single number on your arm. But as a healthy starting point:
| Metric | Meaning | Healthy | Warning | What High Values Suggest |
|---|---|---|---|---|
| Guest CPU usage | CPU actively used inside VM | Workload-dependent | Sustained near saturation | Busy app or undersized VM |
| CPU ready time | Wait time for vCPU scheduling | Very low, often under 2 to 5% | About 5 to 10% | Host oversubscription or contention |
| CPU co-stop | Time SMP VM waits for vCPU coordination | Near zero | Small but recurring spikes | Too many vCPUs or scheduling inefficiency |
| CPU steal time | Time taken by hypervisor from guest in KVM/Linux | Near zero | Recurring bursts | Shared-host contention |
| Load average | Runnable work in guest | Matches workload profile | High with low throughput | Possible CPU wait or I/O wait |
For VMware CPU ready specifically, many admins start investigating once it gets into the mid-single digits and get much more concerned when it stays elevated over time. Short spikes happen. Sustained high values during complaints are what matter.
And check your sampling interval. Averages over an hour can hide ugly 2-minute bursts. p95 or p99 tells a much more honest story.
CPU usage vs CPU ready: what is the difference?
CPU usage is work completed. CPU ready is waiting to begin work. That sounds small, but it's the whole point.
A VM with high CPU usage and low ready time is probably busy because the workload is heavy. A VM with low or moderate guest CPU usage and high ready time is often constrained by the host. Very different fixes.
If you need a quick in-guest check, here's how to check Linux CPU usage. Just remember that's only half the picture in a virtualized stack.
What co-stop means in multi-vCPU VMs
Co-stop shows up mostly with multi-vCPU VMs. It reflects the overhead of scheduling multiple virtual CPUs together. If you give a VM more vCPUs than it really needs, the scheduler has a harder job finding time slots that work cleanly. I've seen oversized 8-vCPU VMs perform worse than right-sized 2-vCPU or 4-vCPU ones for exactly this reason.
More vCPUs isn't automatically better. Sometimes it's like insisting eight people must enter a tiny elevator at the same time — the wait gets longer.
How CPU contention happens on shared hosts
CPU contention usually comes from oversubscription. Too many busy VMs, not enough physical CPU capacity, or poorly sized vCPU allocations. Noisy neighbors can make it worse. Maintenance tasks, backup jobs, or bursty batch workloads can also create ugly scheduling windows.
Here's a real-world pattern: a line-of-business app feels laggy from 9:10 to 9:25 every morning. Guest CPU never exceeds 40%. CPU ready climbs sharply during that same window. Another tenant or another internal workload on the host is hammering the scheduler. The guest alone would never tell you that.
If CPU ready time stays elevated because of shared-host contention, moving to a KVM VPS hosting plan with more predictable resource behavior can make sense. Not as a magic fix — just as the right infrastructure response when the data points there.
Also worth noting: if you're comparing processor models or architecture choices, articles like CPU vs DPU help with broader infrastructure planning, but for troubleshooting a VM, scheduler wait metrics matter more than marketing specs.
And if the machine simply feels off and you need a broader checklist, MonoVM's guide on why a VPS is slow pairs nicely with these virtualization-specific checks.
Disk latency metrics: IOPS, throughput, queue depth, and datastore delay
If CPU looks normal, storage is often the next suspect. And in virtual environments, storage problems can be sneaky. The guest may just show sluggish application response or elevated I/O wait, while the real issue is deeper in the storage path.
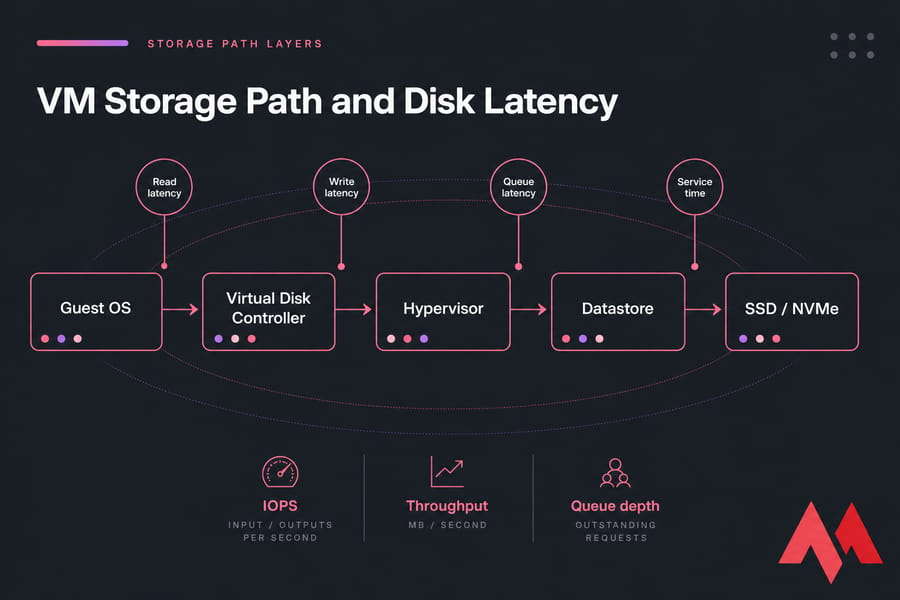
Disk latency is the delay between issuing an I/O request and getting service back. For a VM, that delay can come from the guest OS, the virtual disk layer, the hypervisor, the storage controller, the datastore, or the backing SSD/NVMe/HDD system.
That's why people asking about disk latency vm or vm disk latency usually need more than one number. You need the supporting cast too: IOPS, throughput, queue depth, and sometimes datastore latency.
What disk latency is normal for a VM?
As a rough starting point, single-digit milliseconds are generally fine for many workloads on healthy SSD or NVMe-backed infrastructure. Once you're moving into the teens, you should pay attention. Sustained latency in the 20ms+ range often hurts transactional apps, and databases can feel pain earlier.
But workload matters a lot. A backup repository or archival file server can tolerate more delay than a busy database or low-latency web application. I try not to hand out one-size-fits-all disk thresholds because I've seen sleepy file shares survive 15ms just fine while a chatty database starts coughing well below that.
Latency vs IOPS vs throughput
These get mixed up all the time.
| Metric | Unit | Healthy | Warning | Critical | Notes |
|---|---|---|---|---|---|
| Read latency | ms | Often under 5 to 10ms | 10 to 20ms | 20ms+ | Lower is better; databases are sensitive |
| Write latency | ms | Often under 5 to 10ms | 10 to 20ms | 20ms+ | Write-heavy apps can degrade fast |
| IOPS | operations/sec | Matches workload baseline | Falls while latency rises | Stalls under demand | Volume alone doesn't prove health |
| Throughput | MB/s | Meets expected transfer rate | Flat under rising latency | Bottlenecked path | High throughput can still be slow for small random I/O |
| Queue depth | requests | Low and stable | Growing during peaks | Sustained backlog | Shows storage waiting line |
| Datastore latency | ms | Low, stable | Peak-time spikes | Repeated sustained spikes | Great signal for shared storage contention |
IOPS is how many operations happen per second. Throughput is how much data moves per second. Latency is how long each operation waits. So the classic question — iops vs latency — has a simple answer: IOPS tells you volume, latency tells you pain.
A system can push lots of MB/s during a sequential transfer and still feel awful for a database doing tiny random reads. That's why "high throughput" does not automatically mean healthy storage performance.
Read latency vs write latency
Reads and writes behave differently. Writes often suffer during snapshot activity, replication, cache pressure, or backup windows. Read latency may spike when the working set no longer fits cache or when the array is overloaded.
One pattern I've run into more than once: CPU is fine, memory isn't alarming, but users complain the app drags every night around backup time. Guest disk usage doesn't look outrageous. Then you check datastore latency and see write latency jumping from 3ms to 35ms during the backup window. That's your smoking gun.
How storage contention affects virtual machines
Shared storage means shared pain. One noisy workload can increase queue depth and datastore delay for several VMs. Thin provisioned disks, snapshots left around too long, oversubscribed storage tiers, and old HDD-backed arrays can all contribute.
If you want a primer on disk speed and latency, it's worth reviewing. And if you're choosing infrastructure, the difference between NVMe vs SSD or even SSD vs HDD VPS hosting has a direct effect on what "normal" latency looks like.
For plain capacity checks inside Linux, checking disk space on Linux is useful, but don't confuse capacity with performance. A disk that's only 40% full can still be painfully slow.
Memory monitoring metrics: memory ballooning, swapping, active memory, and page faults
Memory issues in VMs are subtle right up until they aren't. CPU trouble usually announces itself. Storage trouble leaves obvious latency spikes. Memory pressure can simmer for a while, then suddenly crush response time.
The big memory signals to watch are active memory, consumed memory, memory ballooning, guest swap, hypervisor swap, and page faults. These together show whether the VM is comfortably sized or being squeezed by host overcommitment.
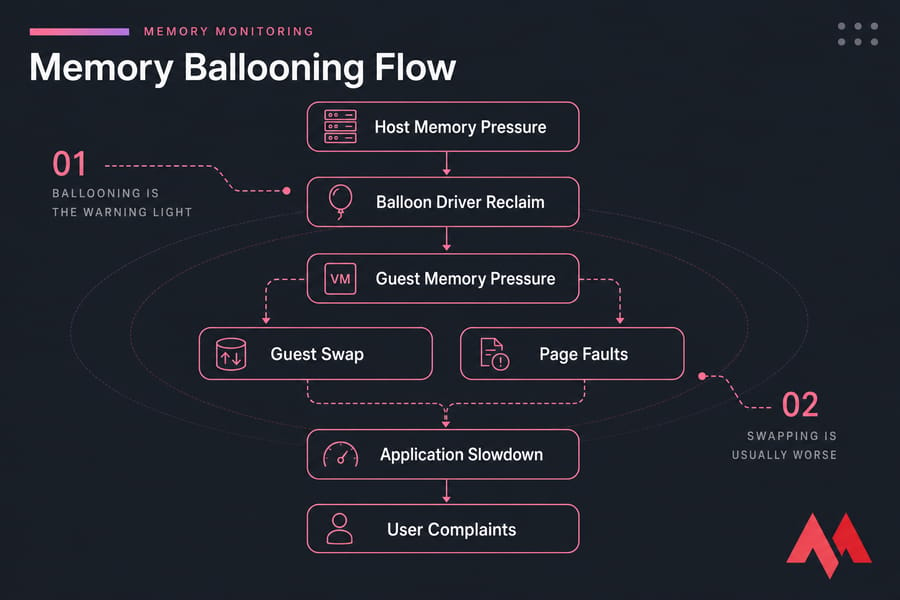
What is memory ballooning in virtualization?
Memory ballooning is a memory reclamation technique used by hypervisors. A balloon driver inside the guest OS allocates guest memory on behalf of the host so the hypervisor can reclaim physical memory from that VM and give it elsewhere.
That sounds weird the first time you hear it. It is a bit weird. But it works.
The key point is this: memory ballooning is not the same as swapping, and it is not automatically catastrophic. It's a signal that the host is under memory pressure and trying to reclaim RAM. Sometimes the guest can give up unused memory pages with little real impact. Other times it starts hurting because the guest needs that memory after all.
Ballooning vs swapping: which is worse?
Swapping is usually worse. Ballooning is the warning light. Swapping is often the actual brake pedal.
| Metric | Meaning | Why It Happens | When to Worry |
|---|---|---|---|
| Active memory | Memory actively used by workload | Normal application demand | When active memory stays close to allocation and performance drops |
| Consumed memory | Physical host memory backing the VM | VM allocation and host policy | When host can't sustain demand cleanly |
| Ballooning | Host reclaims memory through balloon driver | Host memory pressure or overcommitment | When persistent or followed by swap and faults |
| Guest swap | Guest OS moves memory pages to disk | Guest sees memory shortage | Almost always if sustained; causes slowdown fast |
| Hypervisor swap | Host swaps VM memory to storage | Severe host memory pressure | Highly problematic; usually a red flag |
| Page faults | Memory page not immediately available | Normal or pressure-related depending on type | When major faults rise alongside latency and swap |
Ballooning can be survivable. Guest swap is more damaging because now the VM is reading and writing memory pages to storage. Hypervisor swap is worse still in many cases because the host is swapping VM memory externally, often with ugly performance side effects.
Signs of memory pressure inside and outside the guest
Inside the guest, look for swap in/out, rising major page faults, shrinking free memory under load, and apps getting slower without a clear CPU explanation. Outside the guest, look for balloon driver activity, host memory overcommitment, compression, or host swap.
This is where people misread things. They'll see some ballooning and assume disaster, or see low free memory inside Linux and panic. But Linux likes to use memory aggressively for cache, so low free memory by itself isn't the problem. What matters is pressure and reclaim behavior.
If you need an in-guest starting point, here's how to check Linux memory usage. And if you want a refresher on what is virtual memory, that's worth revisiting too.
How overcommitment affects VM memory performance
Overcommitment means the host allocates more virtual memory across VMs than it has physical RAM available. That's not automatically reckless. It can work well if workloads don't all peak together. But when they do, the hypervisor starts reclaiming memory. First with smarter tricks, then with rougher ones.
A typical chain looks like this:
- Host memory pressure rises.
- Balloon driver reclaims memory from guests.
- Guest starts feeling tighter memory conditions.
- Guest swap increases.
- Page faults and disk I/O rise.
- Application response time falls apart.
I've watched this happen during month-end reporting jobs. Everything looked okay until several VMs got busy at once. Ballooning started. Then guest swap kicked in. Then storage latency rose because swapping created extra disk pressure. One problem cascaded into two more.
So is memory ballooning bad? Not always. Is it a warning signal? Absolutely. If ballooning is recurring, active memory is high, and swap follows, that's when you stop treating it as harmless background noise.
If you need to tune the workload or VM itself, MonoVM also has a practical guide to improve VPS performance. A lot of the same right-sizing rules apply here.
Network monitoring metrics for virtual machines: latency, packet loss, throughput, and jitter
Sometimes a "slow VM" isn't a compute problem at all. It's network delay. This shows up all the time with remote desktop sessions, VoIP, trading apps, API servers, and anything chatty across east-west traffic inside a virtualized environment.
The core network metrics to watch in virtualization monitoring are:
- Latency: round-trip delay between systems
- Packet loss: dropped traffic that often forces retries
- Throughput: how much data moves over time
- Jitter: variation in latency, a big deal for real-time apps
- Retransmissions: packets resent because delivery was poor
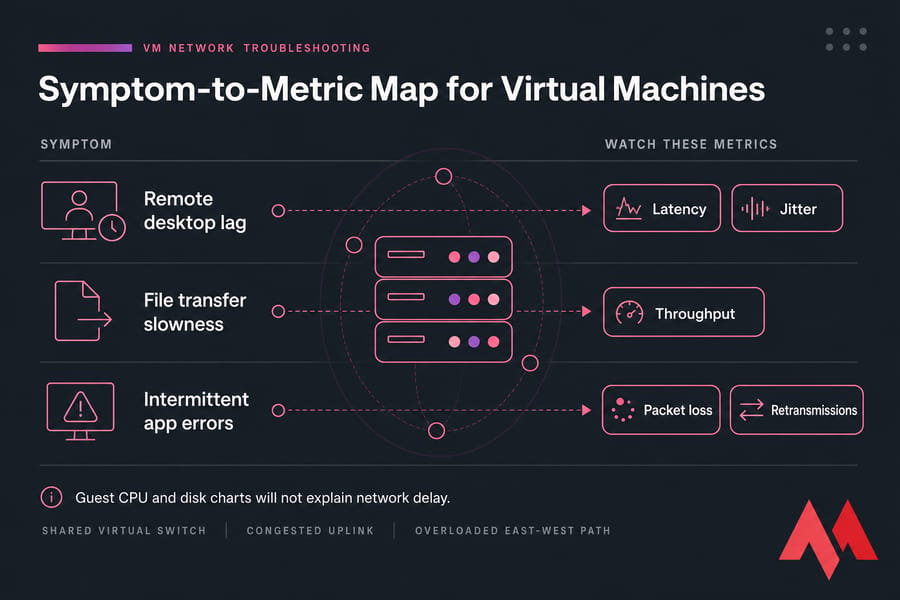
A VM can look slow because packets are delayed on a shared virtual switch, because an uplink is congested, or because east-west traffic between VMs is bouncing through an overloaded path. Guest CPU won't explain that. Disk charts won't either.
For remote desktop and VoIP, jitter matters almost as much as plain latency. For file servers, throughput matters more. For transactional web apps, packet loss and retransmits can quietly wreck response times.
If you want a networking refresher, MonoVM has guides on what is latency and how to reduce it, how to lower ping, and why Forex VPS latency matters so much for timing-sensitive workloads.
The trick is not to wander too far into networking theory. Just ask: do the symptoms line up with transport delay more than CPU, storage, or memory pressure?
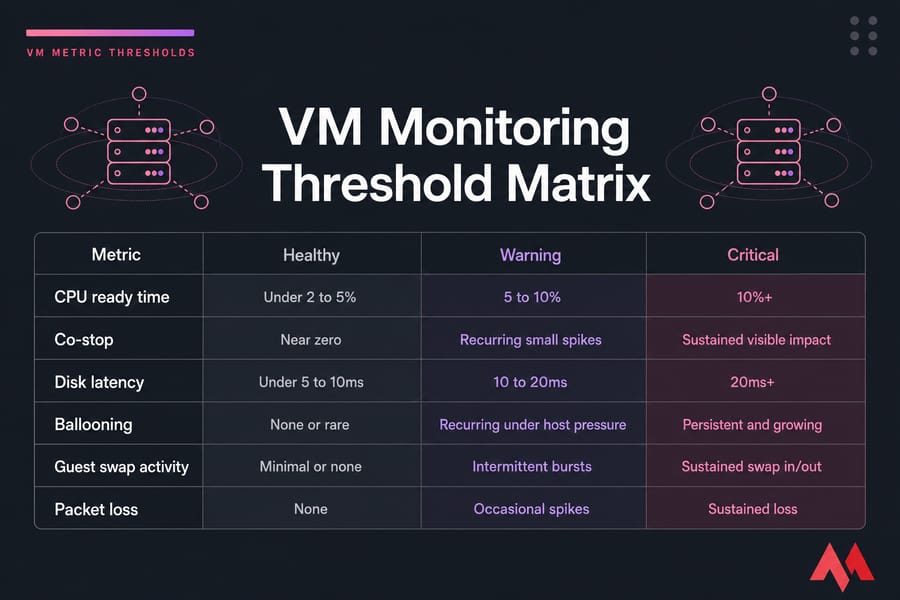
VM metric thresholds: what good, warning, and critical values look like
Everyone wants a threshold table. Fair enough. They're useful. Just don't treat them as laws of physics.
These ranges are best used as starting points for alerting and triage. Your workload baseline matters more than any generic chart. A database, RDP farm, web server, batch node, and backup VM should not all share identical thresholds.
| Metric | Healthy Starting Point | Investigate | Often Problematic | Notes |
|---|---|---|---|---|
| CPU ready time | Often under 2 to 5% | 5 to 10% | 10%+ | Use platform-specific calculation methods; sustained values matter most |
| Co-stop | Near zero | Recurring small spikes | Sustained visible impact | Common with oversized multi-vCPU VMs |
| Steal time | Near zero | Repeated bursts | Sustained high values | Useful in KVM/Linux guest visibility |
| Read latency | Often under 5 to 10ms | 10 to 20ms | 20ms+ | DB workloads may need tighter targets |
| Write latency | Often under 5 to 10ms | 10 to 20ms | 20ms+ | Backup windows and snapshots can spike this |
| Queue depth | Low and stable | Increasing during peaks | Sustained backlog | Correlate with latency and throughput |
| Ballooning | None or rare | Recurring under host pressure | Persistent and growing | Interpret with active memory and swap |
| Guest swap activity | Minimal or none | Intermittent bursts | Sustained swap in/out | Usually degrades application response |
| Hypervisor swap | None | Any occurrence deserves attention | Sustained activity | Usually indicates serious host memory pressure |
| Packet loss | 0% | Any repeated loss | Persistent measurable loss | Real-time apps are especially sensitive |
| Latency jitter | Low and consistent | Variable under load | Frequent spikes affecting sessions | Important for VoIP and interactive apps |
Two things I strongly recommend:
- Alert on p95 or p99, not just averages.
- Compare against a performance baseline gathered over normal business cycles.
Averages are comforting and often misleading. A disk that averages 6ms over an hour might still hit 80ms every five minutes. Users don't experience the average. They experience the spike.
If you need to benchmark VPS performance or want a broader look at VPS monitoring tools, those are good follow-ups once you've built a threshold plan.
How to troubleshoot a slow VM using monitoring metrics
This is where the metrics become useful instead of decorative. When a VM is slow, you don't want 40 graphs. You want an order of operations.
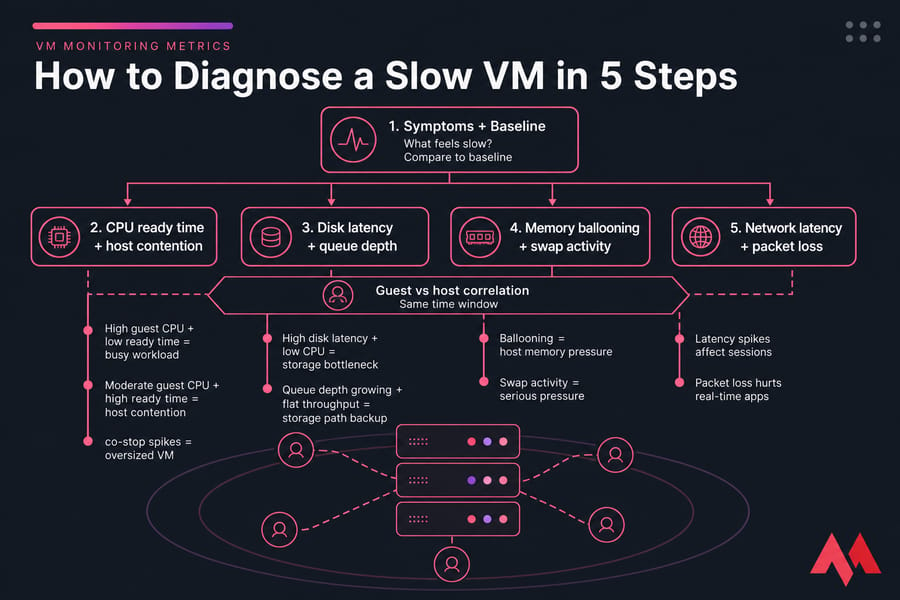
Start with user symptoms and baselines
Step one is boring, honestly, but it saves time. Define the symptom and the time window.
Ask:
- What exactly feels slow?
- When did it happen?
- Was it one user, one app, or the whole VM?
- Is this new, or part of a repeating pattern?
Then compare the current issue against your baseline. If you don't have one yet, start building it now. Without a baseline, every graph looks suspicious.
Check CPU contention first
Compare guest CPU usage with host-side CPU ready, co-stop, or steal time.
- High guest CPU + low ready time usually means the workload is genuinely busy
- Moderate guest CPU + high ready time points to host contention
- Multi-vCPU VM + co-stop spikes suggests the VM may be oversized
This is one of the most useful interpretation rules in VM performance metrics. If the guest doesn't look CPU-bound but users still feel lag, CPU ready is one of the first things I'd check.
Validate storage bottlenecks next
If CPU looks okay, move to disk latency, queue depth, and datastore delay.
- High disk latency + low CPU often means a storage bottleneck
- Queue depth growing with flat throughput suggests the storage path is backing up
- Spikes during backups, snapshots, or replication point to shared-storage contention
This is where correlation matters. Match the latency spike to backup windows, antivirus scans, patching, or batch jobs. You'd be surprised how often the answer is "the storage was busy doing something else."
Confirm memory pressure signals
Now check ballooning, active memory, guest swap, hypervisor swap, and page faults.
- Ballooning + no swap may be an early warning, not an emergency
- Ballooning + guest swap + major page faults is real memory pressure
- Hypervisor swap is usually a serious host-level red flag
This is the subtle one. People often jump to CPU or disk because those feel more familiar. But memory reclamation can silently drag everything down.
Validate network health
If the app is remote, chatty, or interactive, check latency, packet loss, jitter, and retransmissions. A VM can look "slow" because transactions are waiting on the network, not the CPU.
Compare guest and host evidence before acting
Before you change anything, line up both views in the same alert window. That's the habit that separates decent troubleshooting from random knob-turning.
| If You See | Likely Interpretation | What to Check Next |
|---|---|---|
| High ready time + moderate guest CPU | CPU contention | Host oversubscription, vCPU sizing, noisy neighbors |
| High disk latency + low CPU | Storage bottleneck | Datastore load, backups, queue depth, snapshots |
| Ballooning + swap + page faults | Memory pressure | Overcommitment, RAM sizing, host reclaim activity |
| High latency + packet loss | Network issue | vSwitch congestion, uplinks, route path, retransmits |
| Normal guest metrics + poor UX | Hypervisor or shared infrastructure issue | Host-level dashboards and provider visibility |
Also correlate with noisy-neighbor behavior, scheduled patching, antivirus scans, backup windows, and host maintenance. Those side events explain a lot of "random" slowdowns.
If your VM symptoms still feel vague, check MonoVM's guides on why a VPS is slow, how to manage a VPS server. The main point, though, is this: always correlate metrics in the same time window.
Best VM monitoring tools for VMware, Hyper-V, KVM, and VPS environments
The best VM monitoring tools depend on how much visibility you actually have. That's the uncomfortable truth. If you're running your own VMware cluster, you can see CPU ready and datastore metrics directly. If you're on a managed VPS, you may only see guest metrics unless the provider exposes more.
So don't just ask, "Which tool is best?" Ask, "Which tool can see the layer where my problem lives?"
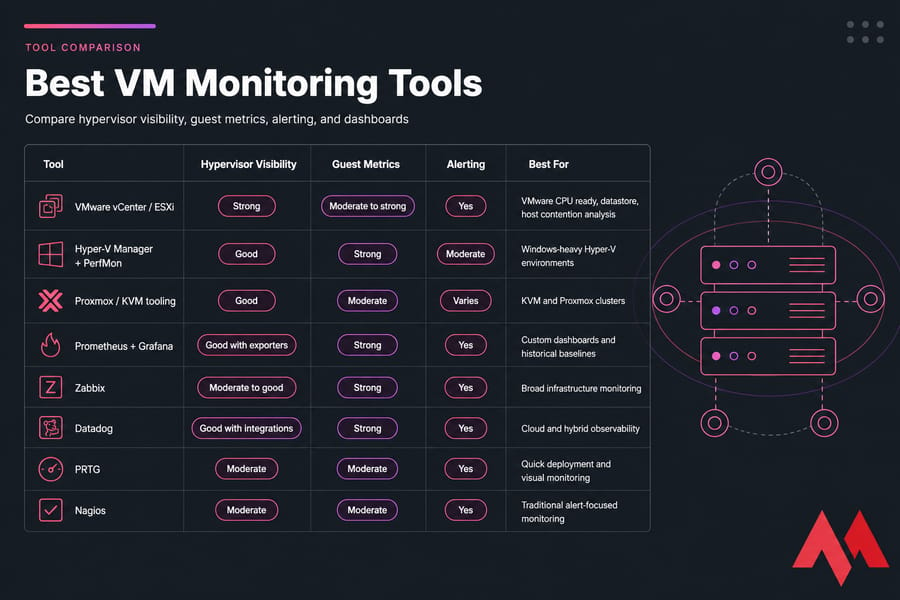
| Tool | Hypervisor Visibility | Guest Metrics | Alerting | Best For |
|---|---|---|---|---|
| VMware vCenter / ESXi | Strong | Moderate to strong | Yes | VMware CPU ready, datastore, host contention analysis |
| Hyper-V Manager + PerfMon | Good | Strong | Moderate | Windows-heavy Hyper-V environments |
| Proxmox / KVM tooling | Good | Moderate | Varies | KVM and Proxmox clusters |
| Prometheus + Grafana | Good with exporters | Strong | Yes | Custom dashboards and historical baselines |
| Zabbix | Moderate to good | Strong | Yes | Broad infrastructure monitoring |
| Datadog | Good with integrations | Strong | Yes | Cloud and hybrid observability |
| PRTG | Moderate | Moderate | Yes | Quick deployment and visual monitoring |
| Nagios | Moderate | Moderate | Yes | Traditional alert-focused monitoring |
| top / htop / iostat / vmstat / sar | Low | Strong in guest | No native historical alerting | Fast command-line checks |
| PerfMon | Low to moderate | Strong in guest | Yes | Windows guest analysis |
Native tools are usually best for hypervisor monitoring. VMware vSphere and vCenter are strong for CPU ready, co-stop, and datastore insights. Hyper-V Manager and Windows Performance Monitor are useful in Microsoft environments. For KVM and Proxmox, you'll often combine platform dashboards with Linux tools and exporters. If you want more on the platform itself, MonoVM's article on KVM virtualization is worth a read.
For longer history, alerting, and dashboarding, Prometheus plus Grafana is still one of my favorite stacks if you don't mind some setup. Zabbix is practical. Datadog is polished. PRTG is quick to get going. Nagios is still around because it works, even if it isn't glamorous.
Selection criteria I actually care about:
- Can it see hypervisor-level metrics like ready time or host reclaim?
- Can it collect guest metrics too?
- Does it support alerting on spikes, not just static averages?
- Can it keep historical baselines for weeks or months?
- Are the dashboards clear enough that your team will really use them?
For VPS users, there's a practical limitation: you may not get direct host visibility. In that case, your monitoring can still show symptoms, but provider support may be needed for deep contention checks. That's not a tooling failure. It's a tenancy boundary.
For a broader roundup, see MonoVM's guide to VPS server management tools.
Common mistakes when interpreting VM performance metrics
Most mistakes come from reading VM performance like it's bare metal. It isn't. The numbers can be technically correct and still misleading if you ignore the virtualization layer.
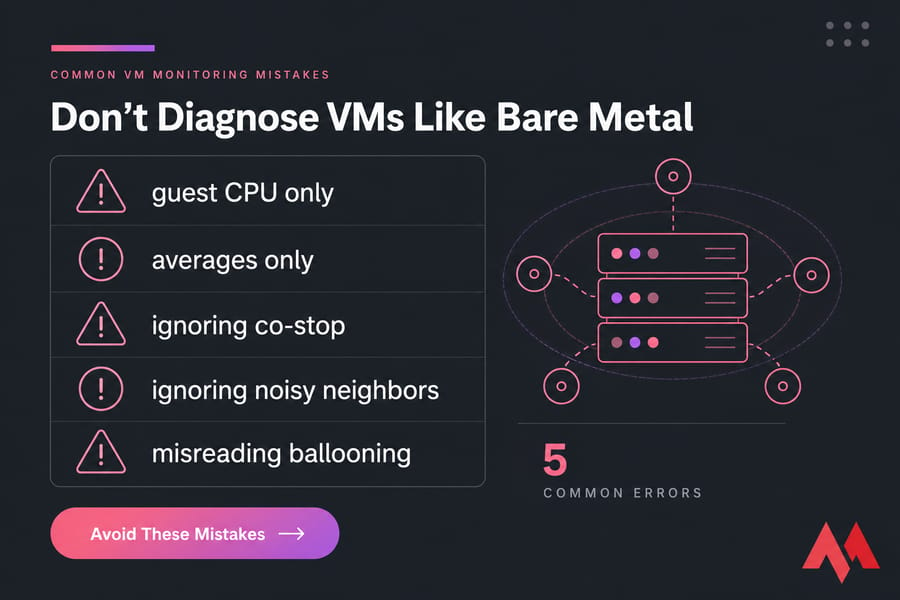
Confusing high CPU usage with CPU contention
High guest CPU usage means the VM is busy. High CPU ready means the VM is waiting. Those are not the same. What to do instead: look at usage, ready, and vCPU sizing together.
Treating ballooning as always catastrophic
Ballooning is a pressure signal, not instant doom. If it appears briefly without swap or app impact, you may just need to watch it. What to do instead: check active memory, guest swap, and hypervisor swap before declaring an emergency.
Looking at averages instead of spikes
This one gets people all the time. Averages smooth away the pain. A VM can average "fine" and still be miserable during p95 or p99 bursts. What to do instead: alert on percentiles and short-interval spikes.
Ignoring host oversubscription and noisy neighbors
If the host is crowded, your VM can suffer even when the guest looks healthy. What to do instead: investigate oversubscription, maintenance windows, and shared-host behavior before tuning the app blindly.
Treating disk utilization as more important than latency
Utilization alone doesn't tell you what users feel. Latency does. What to do instead: prioritize read/write latency and queue depth when diagnosing app slowness.
Failing to baseline by workload
A web server, database, build runner, and remote desktop VM have different normal patterns. What to do instead: establish a baseline per workload, not per vague category like "server."
This is also where confusion around what is a VPS server can muddy expectations. Different hosting models expose different data, and that changes how you troubleshoot.
Next steps: build a VM monitoring baseline and improve performance
The best thing you can do after reading all this? Start collecting a baseline for the next 2 to 4 weeks. Not just averages — collect trend lines, spikes, p95 values, and time-of-day patterns for CPU ready, disk latency, swap, ballooning, and packet loss.
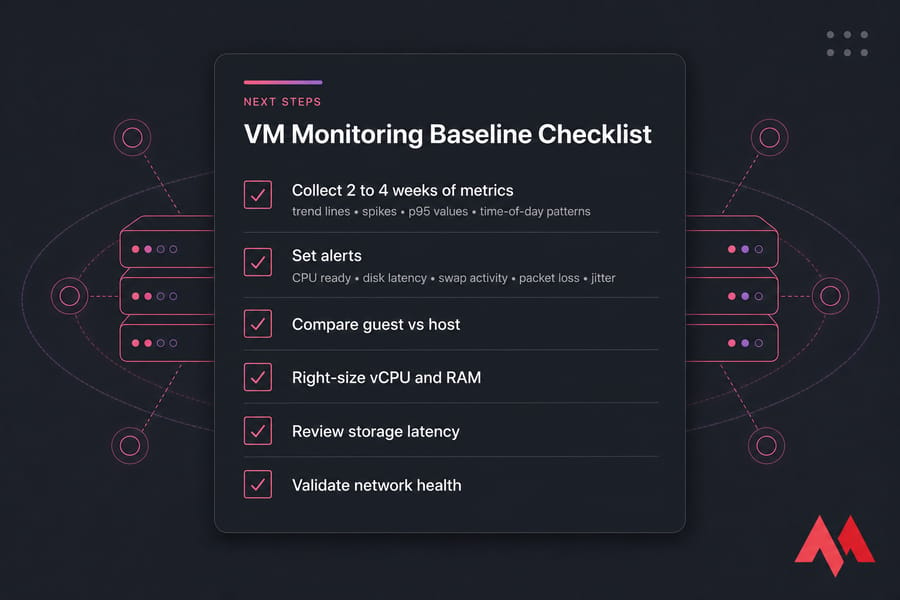
- Set alerts on CPU ready, disk latency, swap activity, packet loss, and recurring jitter
- Right-size vCPU, RAM, and storage instead of over-allocating by guesswork
- Review workload placement and watch for noisy-neighbor patterns
- Benchmark and validate changes after tuning
- Escalate to infrastructure changes when the bottleneck is clearly outside the guest
If your monitoring shows the root cause is infrastructure-level repeated host contention, weak shared storage, or lack of hypervisor visibility — then tuning inside the guest will only get you so far. That's usually the point where faster storage, cleaner isolation, or a better platform matters more than another sysctl tweak.
MonoVM offers NVMe VPS hosting, VM Hosting, and broader VPS hosting plans if you need more predictable VM performance. You also get options across multiple global locations, full root access, Linux and Windows support, and help through 24/7 support. I like that combination because once metrics point to the host, you need infrastructure options, not guesswork.
Turn VM Metrics Into Better Performance
Once you know whether the bottleneck is CPU, memory, disk, or network, the next step is matching your workload to the right environment. Compare MonoVM's plans if you want stronger isolation, fast storage, and room to scale without fighting the platform.
The whole point of VM Monitoring Metrics: CPU Ready Time, Disk Latency, Memory Ballooning, and More is simple: stop guessing. Read guest and host signals together, baseline them properly, and let the metrics tell you where the problem really is.

An experienced tech and developer blog writer, specializing in VPS hosting and server technologies. Fueled by a passion for innovation, I break down complex technical concepts into digestible content, simplifying tech for everyone.