
In the intricate ecosystem of computer systems, CPU usage stands as a vital metric, a heartbeat that pulsates through the digital veins of your Linux operating system. At its essence, CPU usage represents the portion of your system's processing power actively engaged in executing tasks. It is the heartbeat that keeps your system alive and responsive.
Monitoring CPU usage is crucial for efficient system management. Here are three key reasons why it's vital:
- Identifying Performance Bottlenecks: High CPU usage can slow down your system. By monitoring it, you can spot resource-hungry applications and address slowdowns promptly.
- Troubleshooting Problems: High CPU usage often indicates underlying issues like runaway processes. It helps you pinpoint problems and restore system stability.
- Preventing Overload: Just as a conductor ensures harmony in a symphony, checking Linux CPU usage prevents excessive Linux CPU load. By tracking trends, you can allocate resources effectively and avoid system crashes.
In this comprehensive guide, we embark on a journey through the diverse avenues of CPU usage monitoring in Linux. We will unveil the tools and techniques that empower you to harness this critical metric effectively.
How to Check CPU Usage in Linux
In this section, we will explore the myriad ways to check Linux CPU usage, equipping you with the knowledge to harness these tools effectively.
Explore More on Linux Commands!
Dive deeper into the world of Linux with our comprehensive guide. Whether you're a beginner or an experienced user, our extensive collection of articles on Linux commands will enhance your skills and understanding. Click here to unlock the full potential of Linux and streamline your command line expertise!
Below, we provide comprehensive instructions on how to utilize key commands:
Using the top command
Accessing the system's currently running processes and vital metrics can be accomplished by opening a terminal window and executing the command 'top'.
Should you prefer a more focused view that excludes idle processes, the '-i' switch proves helpful:
top -i
As the system continually changes due to the start and completion of background tasks, 'top' remains dynamic, reflecting these alterations in real-time.
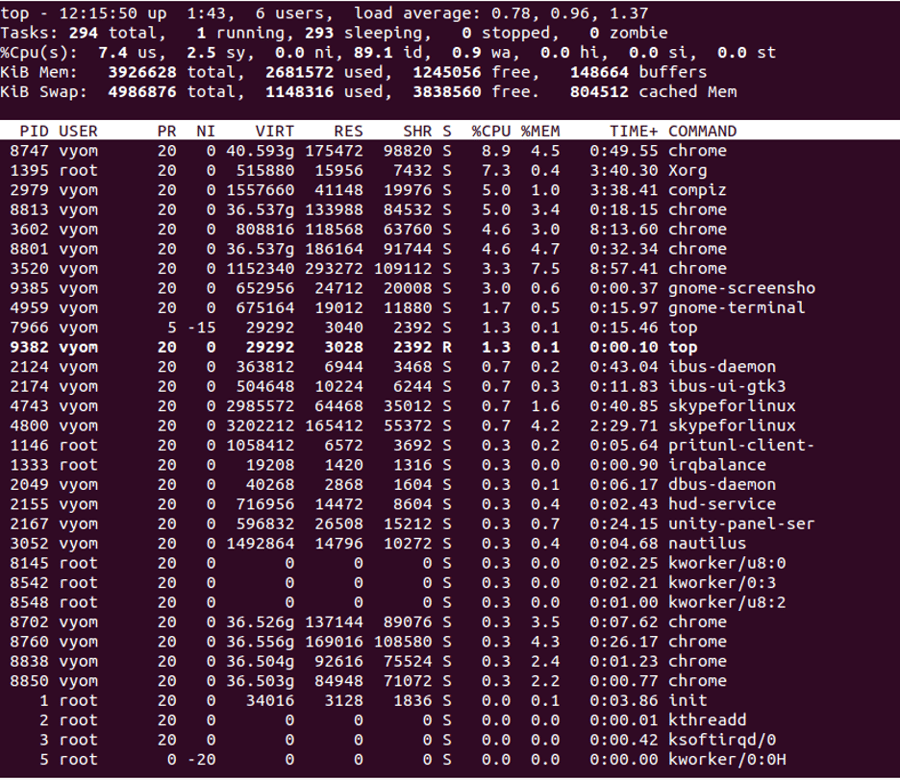
Exiting the 'top' function is straightforward—simply press the 'q' key on your keyboard.
For enhanced usability, 'top' offers several commands while it's running:
- 'M' sorts the task list by memory usage
- 'P' sorts the task list by processor usage
- 'N' sorts the task list by process ID
- 'T' sorts the task list by run time
To access guidance or seek help within 'top', press the 'h' key while the command is running. Alternatively, for a more detailed understanding of 'top', you can access its manual page by entering the following command:
man top
Executing 'man top' will display the comprehensive manual page for the 'top' command, providing in-depth insights into its functionalities and options.
Using the htop command
To gain a comprehensive view of system processes with enhanced user-friendliness, utilize the htop command in your terminal. Executing 'htop' offers a sleek and modern interface, akin to a high-performance sports car compared to the more traditional 'top' utility.
To install and launch 'htop' on your system, use the following commands based on your Linux distribution:
For Debian/Ubuntu systems:
sudo apt-get install htop htop
For CentOS:
sudo yum install htop htop
For a more streamlined view that hides idle processes, 'htop' doesn’t require a specific switch as 'top' does. Instead, it automatically displays only active processes.
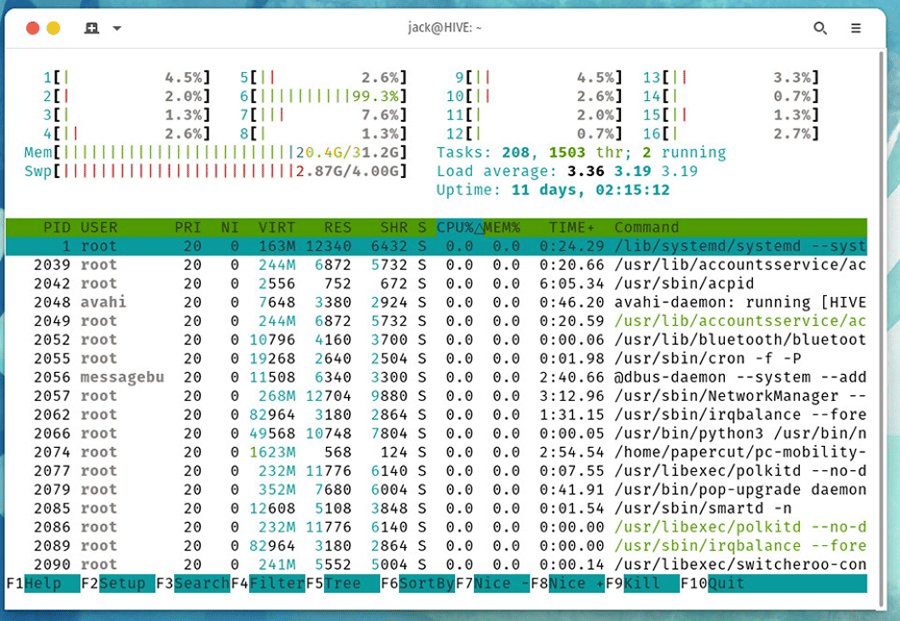
Exiting 'htop' can be done by simply closing the terminal or by using the 'q' key.
Additionally, 'htop' provides several convenient commands during its operation:
- 'F2' accesses setup options
- 'F3' allows for searching processes by name
- 'F4' filters processes based on a given field
- 'F5' refreshes the 'htop' display
- 'F9' enables users to kill selected processes
To explore 'htop' features and functionalities in more detail, access its manual page by entering the following command:
man htop
Using the vmstat command
For real-time and historical insights into your system's performance, 'vmstat' proves to be an invaluable tool. Executing the 'vmstat' command in your terminal provides a wealth of information beyond CPU and memory usage, offering various critical system metrics.
To access Linux CPU usage and a plethora of other system statistics using 'vmstat', simply open a terminal and type:
vmstat
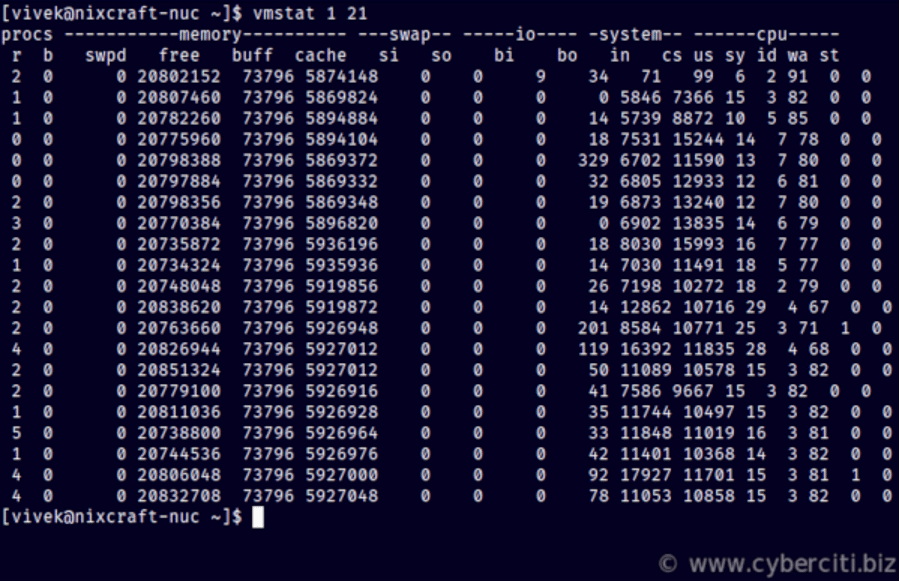
Upon execution, 'vmstat' presents a comprehensive output showcasing CPU usage, memory utilization, processes waiting for execution, I/O information, and system-level activity.
This command offers a dynamic view of system performance, detailing statistics that can assist in optimizing resource utilization and identifying potential bottlenecks.
Using the iostat command
To gather insights into CPU usage and input/output (I/O) activities on your system, use the 'iostat' command in the terminal. Upon execution, 'iostat' provides a snapshot of average CPU utilization from the last system boot and presents details regarding disk read and write activities.
Entering 'iostat' in the terminal prompts the system to showcase crucial metrics such as CPU usage statistics and disk I/O activities. This information is instrumental in understanding the overall performance and load on the system's processors and storage devices since the system was last started.
Using the mpstat command
To harness the 'mpstat' command for CPU analysis, you'll need the 'sysstat' package, which includes 'mpstat' as part of its suite. This package is typically available by default on RHEL-based distributions.
For Debian and Ubuntu systems, installing 'sysstat' is simple:
sudo apt-get install sysstat
Let the installation process complete. However, for older CentOS or Red Hat derivative versions (4.x or older), 'up2date' can be used to install 'sysstat':
sudo up2date install sysstat
For newer CentOS or Red Hat systems (5.x and later), the 'yum' package manager installs 'sysstat':
sudo yum install sysstat
Once installed, the 'mpstat' command becomes available in the terminal. When executed, 'mpstat' presents CPU usage data for each processor or processor core on your system.
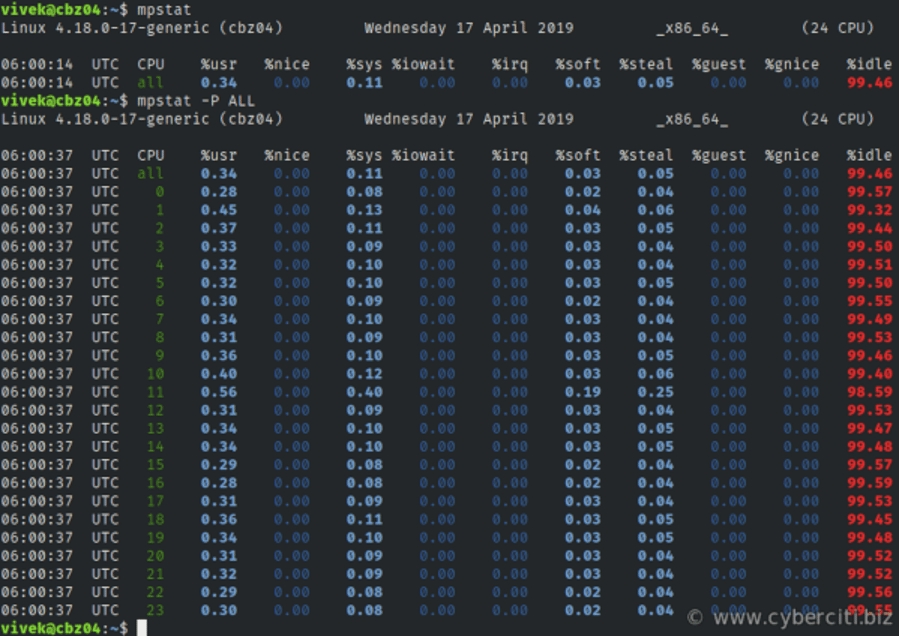
The displayed data consists of labeled columns, where each column indicates different CPU usage aspects:
- %usr – % CPU usage at the user level
- %nice – % CPU usage for user processes labeled as "nice"
- %sys – % CPU usage at the system (Linux kernel) level
- %iowait – % CPU usage idling while waiting for disk read/write
- %irq – % CPU usage handling hardware interrupts
- %soft – % CPU usage handling software interrupts
- %steal – % CPU usage being forced to wait for a hypervisor handling other virtual processors
- %guest – % CPU usage spent running a virtual processor
- %idle – % CPU usage during idle time (no processes and not waiting on disk read/write)
Enhance 'mpstat' functionality using switches:
- Use the -P switch followed by a processor number to obtain reports for a specific CPU:
mpstat -P 0
- The -P ALL switch generates a total report along with individual CPU listings:
mpstat -P ALL
For continuous monitoring, specify a reporting interval and the number of reports:
mpstat 5 7
This example generates 7 snapshots, each 5 seconds apart, allowing for a series of CPU usage observations.
How to Use CPU Usage Information to Identify Performance Bottlenecks
CPU usage data is a treasure trove of information for identifying performance bottlenecks. Here's how to put this data to good use:
- Analyze High CPU Usage: Periodically inspect CPU usage reports to identify processes or applications consistently consuming a significant share of CPU resources. These may be candidates for Linux CPU optimization or resource allocation adjustments.
- Correlate with Other Metrics: Combine CPU usage data with memory usage, disk I/O, and network activity metrics. High CPU usage accompanied by excessive memory consumption or intense disk I/O can provide valuable context for pinpointing bottlenecks.
- Benchmark and Baseline: Establish baseline CPU usage patterns during normal operation. Deviations from this baseline can serve as early indicators of performance issues.
How to Use CPU Usage Information to Troubleshoot Problems
When your system faces issues, CPU usage data can serve as a diagnostic tool. Here's how to use it for effective Linux CPU troubleshooting:
- Identify Resource-Hungry Processes: If your system becomes unresponsive or sluggish, check for processes with abnormally high CPU usage using 'top' or 'htop.' Terminate or investigate these processes to restore normal operation.
- Check for Anomalies: Spikes or sustained high CPU usage can indicate problems like malware infections, software bugs, or configuration errors. Investigate these anomalies promptly to mitigate potential damage.
How to Optimize Your Linux System for Better CPU Performance
Optimizing your Linux system for enhanced CPU performance involves a holistic approach. Here are some tips to consider:
- Update Software: Keep your system and applications up to date to benefit from performance improvements and security patches.
- Manage Services: Disable unnecessary services and daemons running in the background to free up CPU resources.
- Use Efficient Software: Choose applications and software optimized for Linux to minimize CPU overhead.
- Consider Hardware Upgrades: If your system's workload has increased over time, consider upgrading your CPU or adding more RAM to accommodate the demands.
- Kernel Tuning: Explore kernel parameters and configurations to fine-tune your system for optimal performance.
By incorporating these practices into your Linux system management routine, you can ensure that your CPU operates at its best, delivering the performance you need for your tasks and applications.
Troubleshooting Common CPU Usage Issues in Linux
When facing CPU usage problems in Linux, follow these concise steps to diagnose and resolve them:
- Identify the Culprit: Use 'top' or 'htop' to pinpoint processes with high CPU usage.
- Determine the Cause: Check if it's a system process or user application, and review memory and disk usage.
- Take Action: Terminate unnecessary processes or restart problematic applications.
- Monitor and Collect Data: Use 'sar' or monitoring tools, and record when the issue occurs.
- Investigate Logs: Review system and application logs for errors and updates.
- Use Diagnostic Tools: Advanced users can employ 'strace' or 'gdb' for in-depth analysis.
- Check Hardware: Inspect hardware health and consider resource scaling if needed.
- Consult Online Resources: Seek help from Linux forums or communities.
- Professional Assistance: For complex issues, consider involving a Linux system administrator or support services.
Conclusion
Linux system monitoring is crucial for maintaining system performance and stability. By utilizing tools like top, htop, vmstat, iostat, and mpstat, you can gain valuable insights into your Linux CPU utilization.
Remember, to effectively check Linux CPU usage goes beyond simply checking numbers. It involves understanding your system's behavior, identifying performance bottlenecks, and taking proactive measures to ensure optimal system performance.
To delve deeper into Linux performance monitoring, consider exploring additional tools and techniques tailored to your specific needs. A well-optimized system can enhance productivity, prevent downtime, and ensure a smoother Linux experience for both beginners and system administrators.

Hello, everyone, my name is Lisa. I'm a passionate electrical engineering student with a keen interest in technology. I'm fascinated by the intersection of engineering principles and technological advancements, and I'm eager to contribute to the field by applying my knowledge and skills to solve real-world problems.