
Your VPS feels sluggish. Pages take forever to load, your database crawls, and you're wondering whether to tune things or just throw more money at a bigger plan. I've been there more times than I can count — and the honest answer is: you probably don't know yet what's actually slow. That's the whole problem. When managing a production environment, learning how to improve VPS performance is a foundational skill that keeps your applications running smoothly without overpaying for unnecessary virtual hardware allocations.
Most guides jump straight to "install caching" or "enable Gzip." That's backwards. Before you change a single setting, you need to know which resource is the bottleneck. Otherwise you're guessing, and guessing is how people spend a weekend tuning MySQL when the real issue was a runaway cron job. Developing a highly optimized, structured workflow to address system sluggishness saves you from deep technical debt down the road.
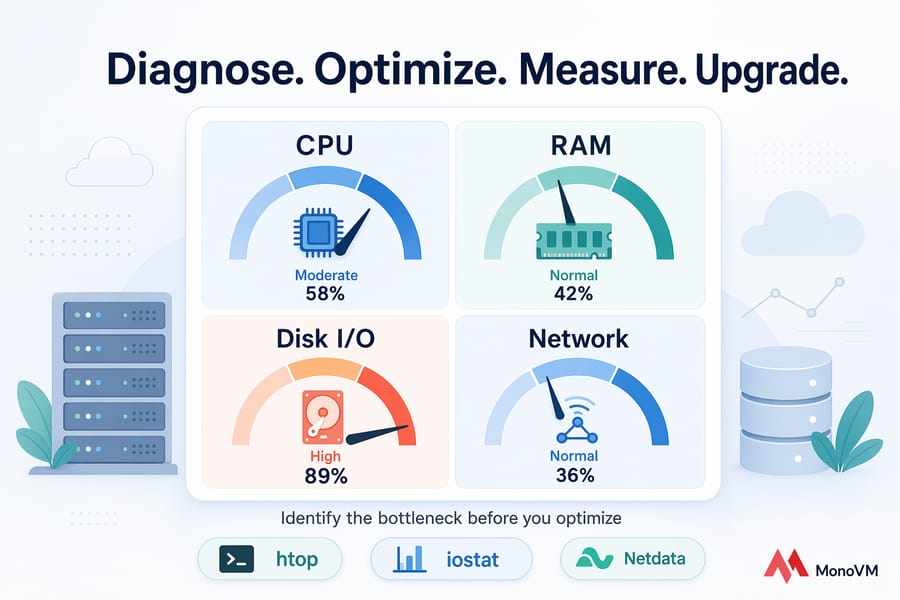
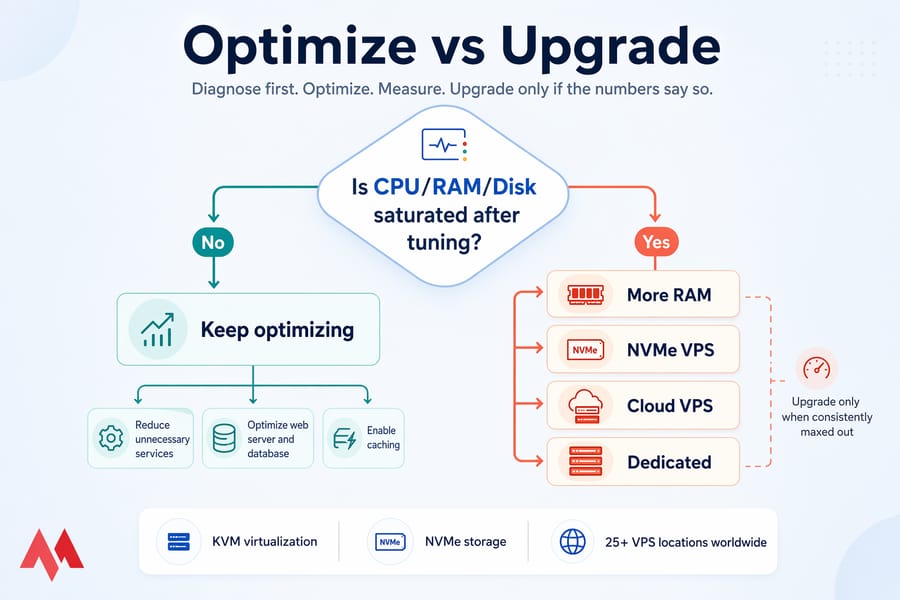
This guide walks through the exact workflow I use when a client messages me saying "the server is slow, please help." We'll diagnose first, optimize second, measure third, and upgrade only if the numbers say so.
🚀 Quick Answer
To improve VPS performance, first identify the bottleneck — CPU, RAM, disk I/O, or network — using monitoring tools like htop, iostat, and Netdata. Then reduce unnecessary services, optimize your web server and database, enable caching, update software, and upgrade to faster NVMe-based resources if your VPS is consistently maxed out.
Key takeaway: Don't optimize blindly — measure first, change second. A single change applied to the wrong layer can waste hours and, occasionally, break things.
🛠️ Before You Start
- SSH access (Linux) or RDP access (Windows) to the VPS
- Ability to safely restart services and applications
- A recent backup or server snapshot (non-negotiable)
- A rough understanding of your workload: WordPress, Node.js API, trading bot, game server, database, etc.
- A baseline metric or two if you already have monitoring — even a screenshot of
htopduring a slow period helps
📊 What affects VPS performance on a server?
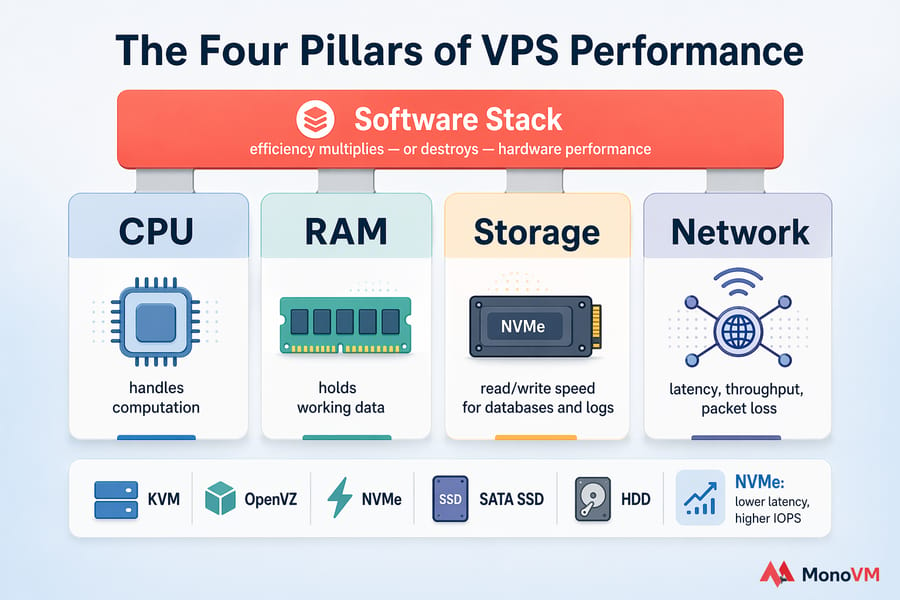
VPS performance comes down to four physical resources and one layer of software sitting on top. When any of the four — CPU, RAM, storage, network — hits a wall, everything else backs up behind it. That's the simple mental model.
But a VPS isn't bare metal. It's a virtual slice of a physical host, usually running under KVM or a similar hypervisor. So what you experience as "my server is slow" might actually be your neighbor on the same physical machine hogging resources. This is called noisy-neighbor contention, and it's more common than providers like to admit.
🖥️ CPU, RAM, storage, and network explained
- CPU — handles computation. If it's pegged at 100%, every request waits in line.
- RAM — holds working data. Run out, and the system starts using disk as fake memory (swap), which is painfully slow.
- Storage (disk I/O) — how fast you can read and write. Databases and log-heavy apps live and die by this number.
- Network — latency, throughput, packet loss. Matters enormously for APIs, game servers, and anyone outside your datacenter's region.
⚙️ The difference between server resources and software efficiency
Here's the thing people miss. A 4 vCPU VPS running a badly written WordPress plugin can feel slower than a 1 vCPU VPS running clean, cached code. Software efficiency multiplies — or destroys — whatever hardware you've paid for. That's why this guide treats tuning the stack as equally important as picking the right plan.
🌐 Why virtualization type and storage media matter
KVM-based virtualization generally outperforms older OpenVZ containers because resources are allocated more predictably. On the storage side, NVMe delivers dramatically lower latency and higher IOPS than SATA SSDs — and SATA SSDs destroy old spinning disks. If your provider is still on HDD or oversold SATA arrays, no amount of tuning will save you. For context, see our breakdown of NVMe vs SSD and the fundamentals in what a VPS server is. To ensure that your bare resources match your architectural demands, choosing the right baseline virtualization via a robust KVM VPS environment ensures true hardware isolation and dedicated kernel parameters.
⚠️ Why is my VPS slow? Common performance bottlenecks
Before you touch a single config file, figure out which bottleneck is causing the pain. Symptoms matter. Here's what I look at first.
⚠️ Signs of CPU saturation
- Load average sustained above your vCPU count (e.g., load of 5 on a 2 vCPU VPS)
- Response times grow during peak but CPU graphs stay near 100%
- SSH itself feels laggy — typing has visible delay
%st(CPU steal) above 5–10% consistently — that's host-side contention, not your fault
⚠️ Signs of memory pressure and swap thrashing
- Free RAM near zero and swap actively filling up
- High
si/sovalues invmstat— the system is constantly swapping pages in and out - OOM (out-of-memory) killer logs in
dmesgor/var/log/messages - MySQL or Node processes getting killed randomly
⚠️ Signs of disk I/O bottlenecks
- High
iowaitintop(above 20% sustained is a red flag) - Database queries that used to take 50ms now take 2 seconds
- Backups or log rotation making the entire server unresponsive
- Slow file operations even on small files
⚠️ Signs of network or provider-side issues
- Random latency spikes despite low local CPU
- Packet loss in
mtrorping - Fine during off-hours, terrible during the same window every day (classic noisy neighbor)
- Bandwidth throttling or hitting your plan's cap
For a deeper dive into host-side causes and fixes, our article on why your VPS is slow breaks this down further. And if you suspect storage, our piece on what disk speed actually means is worth a read.
| Symptom | Likely Cause | Metric to Check | First Fix |
|---|---|---|---|
| Slow page loads, high CPU | CPU saturation or runaway process | Load average, %CPU per process |
Kill or limit the offending process |
| Random app crashes | Out of memory | Free RAM, swap usage, OOM log | Reduce worker counts or add RAM |
| Slow DB queries | Disk I/O bottleneck | iowait, IOPS |
Clean logs, tune queries, consider NVMe |
| Latency spikes | Network contention or packet loss | mtr, ping, bandwidth graphs | Contact host, check datacenter location |
| Server feels slow, metrics look fine | CPU steal / noisy neighbor | %st in top |
Ask provider, migrate if persistent |
| Sluggish after backup window | Scheduled I/O collision | Cron logs + iostat timeline | Stagger jobs, move backups off-peak |
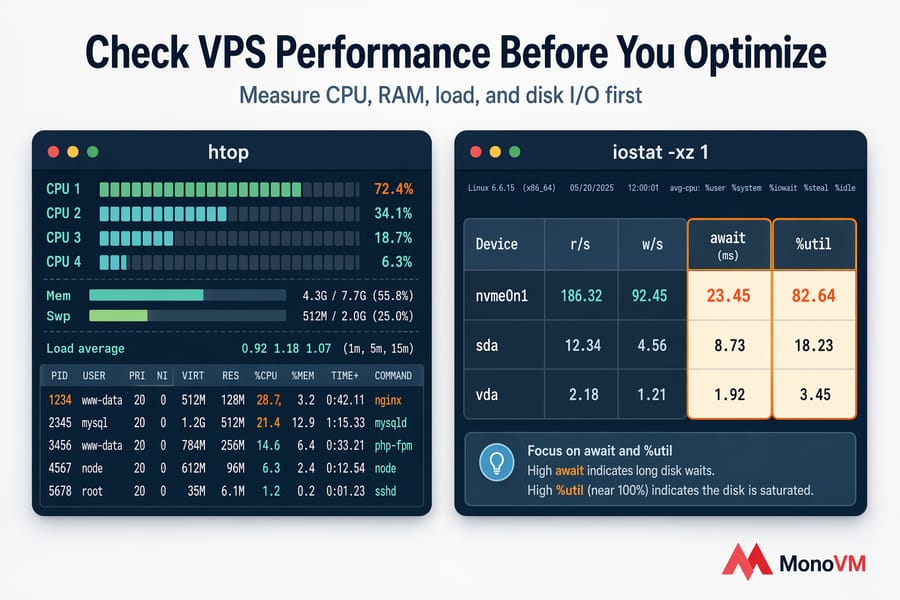
🔍 How to check VPS performance before you optimize
This is the part most tutorials rush through. Don't. A five-minute diagnostic session will save you from ten hours of pointless tuning.
📋 Linux commands to check CPU, RAM, disk, and load
Here's the minimum toolkit I reach for every single time:
htop— live view of processes, CPU, memory, load average. Color-coded, sortable, and honest. To get a complete overview of this tool's display fields, review our operational guide on what is htop and what does it do.free -m— RAM and swap in megabytes. Look at available, not just free.vmstat 1 10— sampled 10 times over 10 seconds. Thesiandsocolumns reveal swap thrashing.iostat -xz 1— disk activity with%utilandawait. If%utilis near 100, your disk is the limit.df -h— disk space usage. Don't confuse "disk full" with "disk slow."sar— historical performance data if sysstat is installed. Gold for spotting patterns.
For walkthroughs with actual output examples, see how to check Linux CPU usage, how to check Linux memory usage, and how to check disk space in Linux.
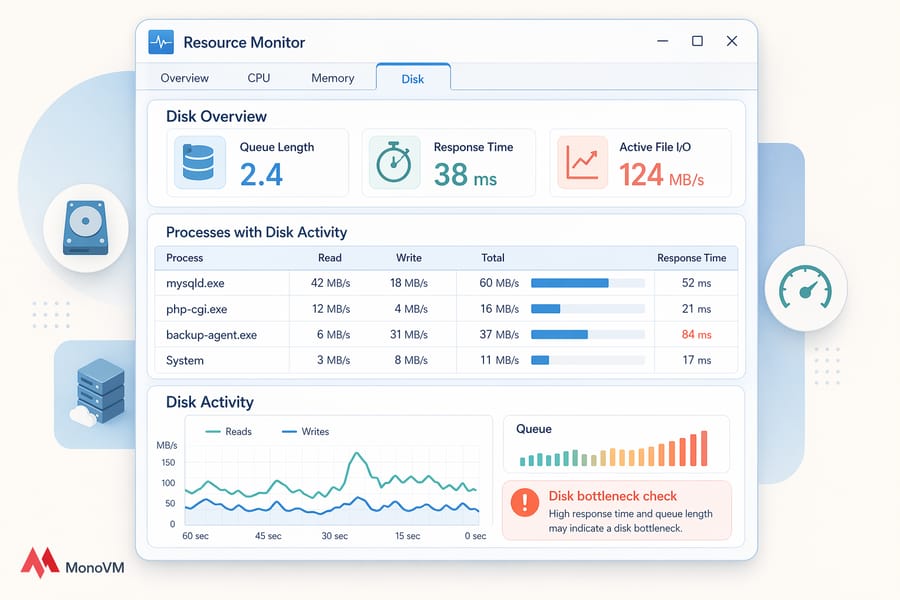
🪟 Windows tools to inspect VPS resource usage
Windows VPS users get a different but similarly capable toolkit:
- Task Manager — quick snapshot of CPU, memory, disk, and network per process.
- Resource Monitor (
resmon) — deeper view, including disk queue length and network connection details. - Performance Monitor (
perfmon) — granular counters with historical logging. Overkill for quick checks, perfect for long-term trends. - Event Viewer — don't skip this. Services crashing or restarting silently often show up here before anywhere else. When unexpected crashes occur on a Microsoft-based infrastructure, consult our reference guide for diagnosing a random service crash within Windows VPS environments.
📈 What metrics mean your VPS has a real bottleneck
These aren't absolute laws, just practical guidelines I've refined over years:
- CPU above ~85% sustained for more than a few minutes during normal load
- Load average consistently higher than the vCPU count
- Swap in active use with low available RAM
iowaitabove ~20%- CPU steal (
%st) above ~5–10% — hints at a crowded host - Disk partitions above 85% full (filesystems slow down as they fill)
Pro tip: Change one thing at a time. Capture a baseline. Apply the fix. Measure again. If you change five things at once and performance improves, you have no idea which change helped.
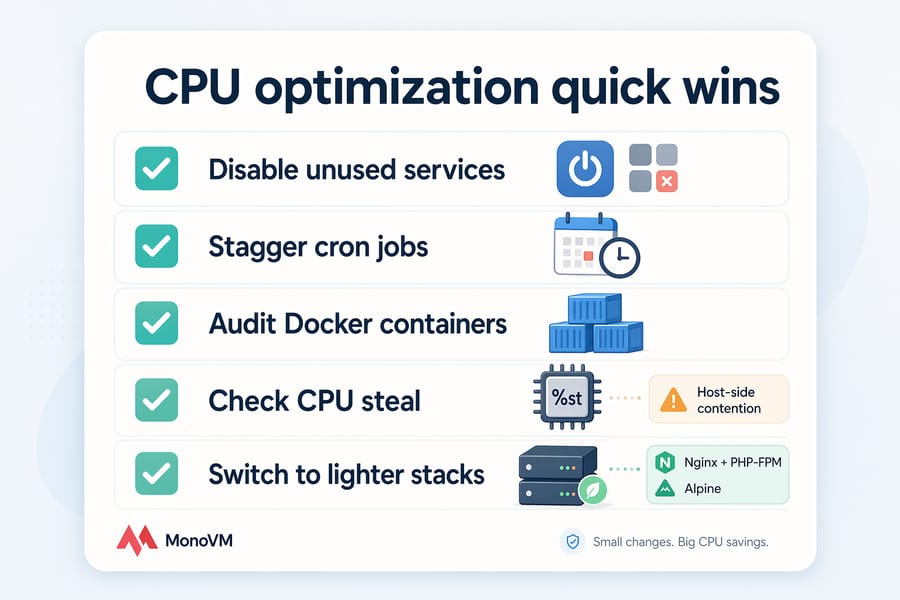
⚡ Optimize VPS CPU usage by reducing waste
If CPU is your bottleneck, the fastest wins come from stopping work your server shouldn't be doing in the first place.
❌ Stop unnecessary background services
Run systemctl list-units --type=service --state=running and scan for anything you don't need. Common culprits on stock VPS images: snapd, ModemManager, accounts-daemon, unused mail services like postfix if you're not sending mail, or GUI-related services on a headless box.
Disable, don't just stop:
sudo systemctl disable --now servicename🛑 Limit runaway processes and cron jobs
Overlapping cron jobs are a silent killer. I once debugged a server that felt terrible every night at 3 AM — turned out backups, log rotation, and an analytics job were all firing simultaneously, saturating CPU and disk.
- Check
crontab -land/etc/cron.*for overlapping schedules. Understanding what is cron job management can prevent concurrent resource conflicts. - Stagger heavy jobs — move backups to off-peak hours
- Use
flockto prevent the same job from running twice if the previous one is still going - Find hungry processes with the Linux process list and, if necessary, use the kill command to end them
🕊️ Choose lighter software where possible
Apache with mod_php eats more CPU per request than Nginx with PHP-FPM. A Docker container running a full OS consumes more than a minimal Alpine-based one. Small choices compound at scale.
A note on CPU steal: if you see %st consistently high, no amount of local tuning fixes it. That's the host's problem, not yours. Document the steal percentages with timestamps and open a support ticket — or move.
🧠 Improve VPS RAM usage and reduce swap pressure
Memory pressure is sneaky. Everything appears to work, it just works slowly, because the kernel is constantly shuffling pages between RAM and swap.
🔍 Find memory-hungry processes
In htop, sort by %MEM. On WordPress sites, it's almost always PHP-FPM workers. On Node.js apps, it's usually an unbounded process or memory leak. On trading bots, it's often one Python script loading way too much historical data into memory.
⚙️ Tune PHP, MySQL, and worker limits
The most common mistake I see: PHP-FPM configured with pm = dynamic and pm.max_children = 50 on a 2GB VPS. That allows 50 workers × ~40MB each = 2GB just for PHP. No room left for MySQL or the OS.
- Set
pm.max_childrenbased on (available RAM − reserved) ÷ average worker size - For MySQL/MariaDB, tune
innodb_buffer_pool_size— too small means slow queries, too large means OOM kills - Apache: reduce
MaxRequestWorkersif you're on prefork MPM - For WordPress specifically, see our guide on increasing allocated memory in WordPress — especially if you're hitting the 256M wall
📈 When adding RAM is better than tuning
If your workload genuinely needs more memory than your plan offers — say, a database whose working set is larger than your RAM — tuning just rearranges the deck chairs. Upgrade. There's no tuning trick that makes 2GB act like 8GB.
A word on swap: don't disable it entirely. A small swap partition acts as a safety net, preventing hard OOM kills. The problem isn't swap existing, it's swap being used continuously. When system processes exceed physical capacities, knowing how the kernel processes pages reveals the deep architecture of what is virtual memory layout configurations.
💾 Fix disk I/O bottlenecks and improve storage speed
Disk is where a lot of "mystery slowness" lives. CPU looks fine, RAM looks fine, but the site still crawls. Check iowait.
Warning: High disk usage (filesystem full) and slow disk speed (low IOPS) are two different problems. Don't confuse them.
📊 Check disk usage, IOPS, and throughput
df -hshows how full your partitions areiostat -xz 1shows IOPS and utilization in real timeioping -c 10 /measures single-operation latencyfiogives you proper benchmarks — but run it off-peak, never during production traffic
🧹 Clean logs, temp files, and unused packages
This is unglamorous but effective:
- Rotate and compress logs (
logrotateis your friend) - Clear old package caches:
apt cleanon Debian/Ubuntu,dnf clean allon RHEL-family - Find the biggest directories:
du -h --max-depth=1 / | sort -h - Delete old backups that should have been moved off-server weeks ago
- Be careful, though — don't nuke logs you might need for compliance or incident response
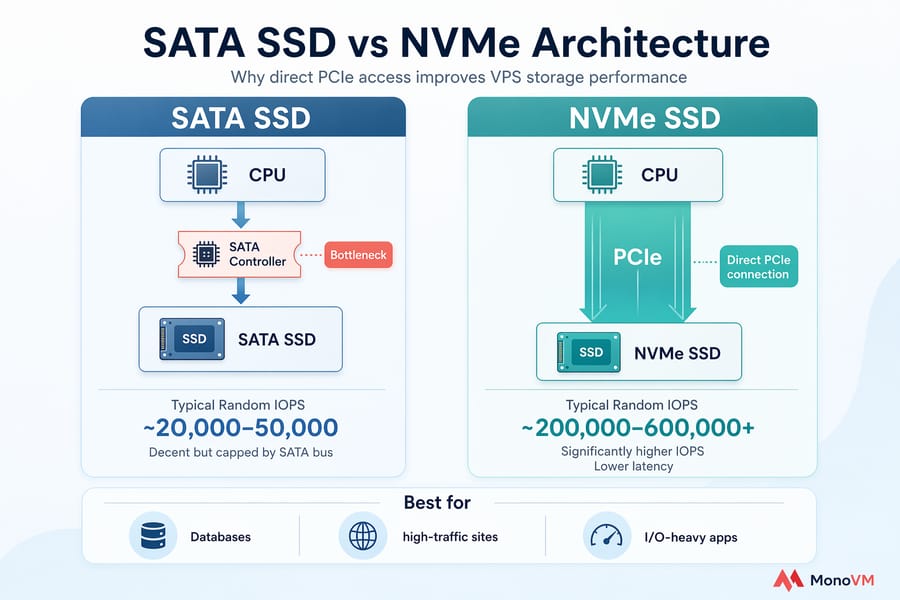
🚀 Why NVMe VPS hosting can outperform standard SSD
NVMe drives connect directly via PCIe instead of going through the SATA controller. The result: significantly higher IOPS and lower latency, particularly for the small random reads that databases hammer constantly. For WooCommerce stores, busy forums, DB-heavy SaaS apps, or any workload that generates lots of small writes, the difference is noticeable — not marketing fluff.
| Storage Type | Typical Random IOPS | Best For | Trade-off |
|---|---|---|---|
| HDD | ~100–200 | Cold storage, backups | Far too slow for live workloads |
| SATA SSD | ~20,000–50,000 | General-purpose sites and apps | Decent but capped by SATA bus |
| NVMe SSD | ~200,000–600,000+ | Databases, high-traffic sites, I/O-heavy apps | Premium pricing, worth it if I/O-bound |
For the full comparison, see HDD vs SSD and NVMe vs SSD. If you're already on SSD and still I/O-bound, NVMe VPS hosting is usually the right next step. For workloads that don't need the absolute fastest storage, SSD VPS remains a solid value pick.
🛠️ Optimize web server and database performance on VPS
Once your hardware isn't the bottleneck, most remaining gains come from the software stack. This is where you can turn a slow VPS into a snappy one without spending another dollar.
🌐 Nginx vs Apache tuning basics
Nginx handles static content and high-concurrency connections more efficiently than Apache out of the box. If you're running Apache with mod_php, switching to Nginx + PHP-FPM is often the single biggest win for a WordPress VPS.
Core knobs worth adjusting:
- worker_processes — set to
autoin Nginx, it'll match vCPUs - worker_connections — bump to 1024 or 2048 for busy sites
- keepalive_timeout — keep it, but don't make it huge; 15–30s is sensible
- Enable HTTP/2 (or HTTP/3 if your stack supports it) for multiplexed connections
For Apache, reduce MaxRequestWorkers if you're memory-constrained, and switch to the event MPM if you haven't already.
🗄️ Database optimization for MySQL and MariaDB
A slow database makes every request slow. Start here:
- Enable the slow query log and look at queries taking more than 1 second
- Add indexes on columns used in
WHERE,JOIN, andORDER BYclauses - Tune
innodb_buffer_pool_sizeto roughly 50–70% of available RAM if the DB is the main workload - Run
mysqltunerperiodically for a sanity check - For WordPress, clean bloated tables and revisions — our guide to optimizing WordPress databases covers this in detail
⚡ Use Redis or OPcache to reduce repeated work
This is where I've seen 5× improvements without touching hardware. OPcache caches compiled PHP bytecode, so PHP isn't recompiling the same scripts on every request. Redis (or Memcached) caches database query results and sessions.
- Enable OPcache in PHP — it's usually a one-line ini change
- Install Redis following our Redis on Ubuntu guide
- For WordPress, pair Redis with a plugin like Redis Object Cache
- For Node.js and APIs, cache expensive computations or external API responses
If you're running a control panel like cPanel or Plesk, remember they consume resources themselves. On a tiny 1GB VPS, the panel alone can eat a quarter of your RAM. Our roundup of best VPS control panels covers lighter options. To scale smoothly, selecting specialized server blueprints like a dedicated cPanel VPS deployment minimizes system conflicts through highly standardized library paths.
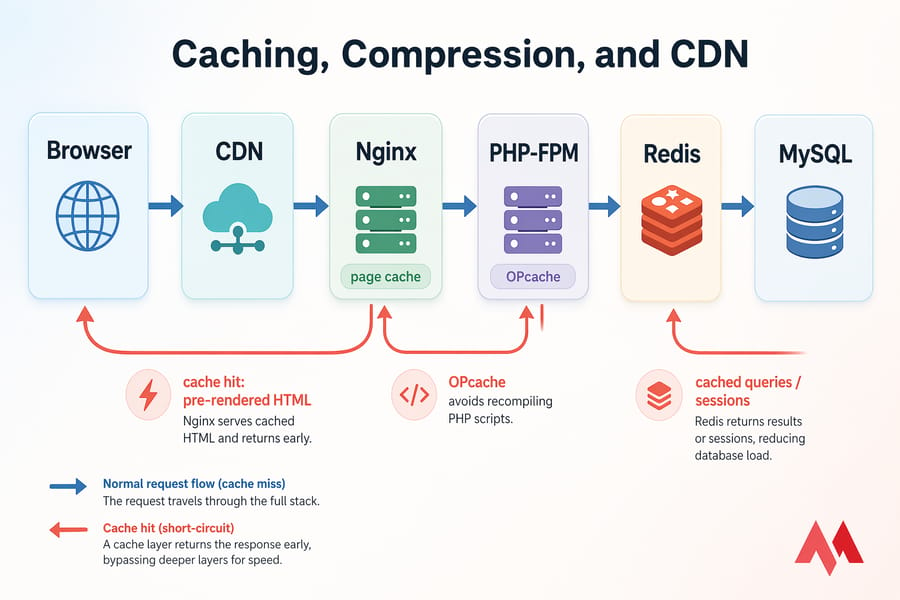
⚡ Speed up VPS applications with caching, compression, and CDN
Caching is the cheat code of web performance. Every request you don't have to process is a request your VPS doesn't have to burn resources on.
📦 Page caching and object caching
- Page caching — serves a pre-rendered HTML page instead of running PHP and querying the DB. Massive wins for content sites.
- Object caching — stores individual DB query results in memory (via Redis/Memcached) for dynamic apps where full page caching isn't viable.
- Opcode caching — OPcache for PHP, already covered above.
- Browser caching — set proper
Cache-Controlheaders on static assets so returning visitors don't re-download them.
🗜️ Gzip or Brotli compression
Compressing responses before sending them shrinks payload sizes by 60–80%. Brotli compresses slightly better than Gzip but has higher CPU cost at maximum levels — most setups use Brotli at level 4–6, which is a good balance.
🌐 When a CDN improves VPS response times
A CDN caches your static assets (images, CSS, JS, fonts) at edge locations around the world. For a global audience, this dramatically reduces time-to-first-byte for users far from your origin. For a local-only service, the gain is smaller.
Here's the catch: a CDN doesn't fix slow database queries or an overloaded CPU. If your origin is slow to generate the HTML, the CDN still waits for that slow origin. Read our explainer on what a CDN actually is and when it makes sense. For broader site-level wins, see how to increase website speed.
Pro tip: The biggest performance gains usually come from eliminating repeated work with Redis and OPcache — not from CDNs or compression. Do the cheap server-side wins first.
🛡️ Keep your VPS updated, secure, and stable for better performance
An unpatched VPS isn't just a security risk — it often runs slower, too. Performance fixes regularly ship inside security updates and minor version bumps.
🔄 Why outdated packages hurt performance
- Newer kernels include better schedulers and I/O paths
- MySQL/MariaDB minor versions often contain query optimizer improvements
- PHP 8.x is measurably faster than 7.x, and 7.x than 5.x
- Outdated TLS libraries mean slower HTTPS handshakes
🛡️ Security bloat vs necessary protection
Some security tools are resource hogs — particularly on small VPS plans. A full-featured endpoint agent on a 1GB VPS can leave you with almost nothing for the actual workload. Be selective.
- Use a lightweight firewall (
ufworfirewalld) rather than heavy commercial suites on small plans - fail2ban is light and effective for blocking brute-force attempts
- SSH key authentication is free and removes an entire attack class
- See our VPS security tips and the full Linux VPS hardening guide
Warning: Never disable security tooling to chase a performance win. A compromised server that's mining crypto or sending spam is the ultimate performance killer — and I've seen it happen to plenty of people who "temporarily" turned off their firewall.
🔄 Reboot, kernel, and service maintenance best practices
- Reboot after kernel updates — yes, really, even if it's inconvenient
- Clean up old kernels:
apt autoremove(Debian/Ubuntu) ordnf removeselectively - Audit installed packages occasionally — you'll find things you installed two years ago and forgot about
- If performance suddenly tanks with no config change, check for compromise: unusual outbound traffic, unknown processes, weird cron jobs
📈 Use VPS monitoring tools and benchmark tools to track improvements
You can't prove an optimization worked without measurement. And you can't catch the next slowdown early without continuous monitoring.
📊 Best monitoring tools for ongoing VPS health
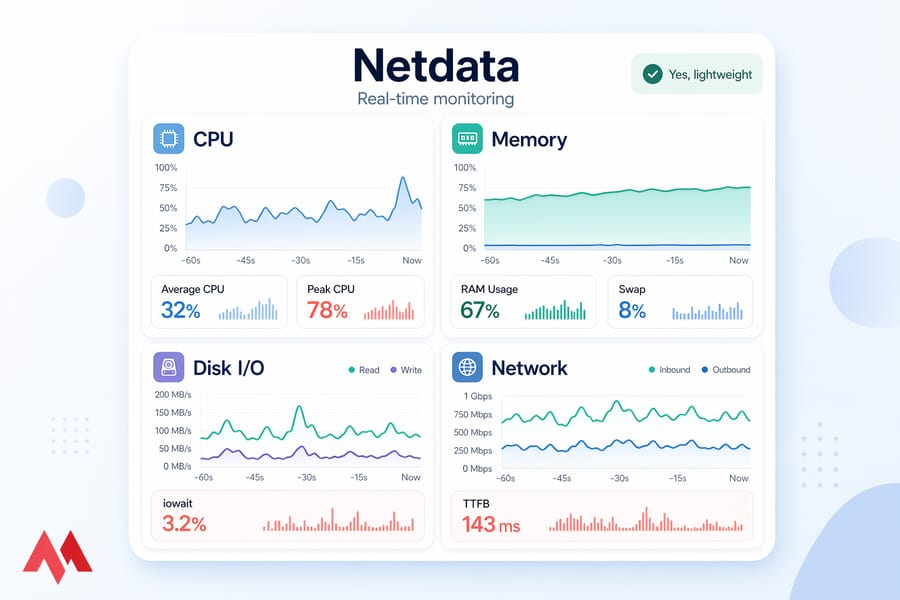
- Netdata — install with one command, get a beautiful real-time dashboard. My default for most VPS.
- Prometheus + Grafana — more setup, but ideal if you're managing multiple servers or want custom alerts
- Uptime Kuma — self-hosted uptime monitoring, great complement to resource monitoring
- Built-in tools —
sar, Performance Monitor — free and already installed
For a fuller comparison, see our guide to VPS monitoring tools.
🛠️ How to benchmark disk, CPU, and network safely
- fio — disk benchmarks (random/sequential reads and writes)
- sysbench — CPU, memory, and DB benchmarks
- iperf3 — network throughput
- ab or wrk — HTTP load testing against your web server
Run these off-peak. Benchmarking during production traffic distorts results and annoys your users. Our roundup of VPS benchmark tools has deeper detail on each.
| Tool | Best For | OS | Safe on Production? |
|---|---|---|---|
| Netdata | Real-time monitoring | Linux, Windows (limited) | Yes, lightweight |
| Prometheus + Grafana | Long-term metrics, alerts | Linux | Yes |
| fio | Disk benchmarking | Linux | Off-peak only |
| sysbench | CPU/DB benchmarks | Linux | Off-peak only |
| iperf3 | Network throughput | Linux, Windows | Yes, brief tests |
| Perfmon | Windows resource logging | Windows | Yes |
📋 Build a before-and-after optimization checklist
Capture these numbers before any change:
- Average CPU and peak CPU over 24 hours
- Average and peak RAM usage, including swap
iowaitduring peak load- Server response time (TTFB) from a consistent test location
- Database query times for your top 5 queries
Then change one thing. Wait 24 hours. Re-measure. Repeat.
📈 When VPS optimization is not enough and you should upgrade
Tuning has limits. At some point, the honest answer is: your plan is too small for the job. Here's how to tell.
🛑 How to know your VPS plan is undersized
Signs you've hit the ceiling:
- CPU consistently above 80% even after killing every unnecessary process
- Memory fully used with swap constantly active, and you've already tuned workers and buffers
- Disk I/O saturated despite cleanup, and you're already on SSD
- Traffic has grown 3× in the past six months and shows no sign of stopping
- Multiple applications competing for resources that neither can spare
- Performance collapses every time traffic spikes above a predictable threshold
🔄 When to move to managed VPS, cloud VPS, or dedicated server
Different upgrade paths fit different problems:
- More RAM/CPU on the same VPS line — easiest, cheapest, fixes straightforward resource ceilings
- NVMe VPS — the right move if you're I/O-bound (databases, WooCommerce, log-heavy apps, trading bots writing constant state)
- Cloud VPS — if your traffic is spiky and you need to scale on demand
- Linux VPS — the flexible workhorse for most developers and site owners
- Managed hosting — if you'd rather pay someone else to handle the tuning, patching, and monitoring
- Dedicated server — when you've genuinely outgrown virtualization and need full hardware control
📋 What MonoVM VPS features matter for performance
When you're evaluating any provider (us included), these are the things that actually move the needle:
- KVM virtualization (predictable resource allocation, no OpenVZ-era quirks)
- NVMe storage for workloads that need real IOPS
- Datacenter location close to your users — we run 25+ VPS locations worldwide
- Real 24/7 support when things break at 2 AM — see our support options
- Honest resource allocation (not heavily oversold, which is why CPU steal stays low)

💻 Real-world examples by workload type
Because theory only gets you so far, here's how these principles apply to the workloads I see most often:
- WordPress site — enable OPcache, install Redis object caching, use page caching, switch to PHP 8.x, keep PHP-FPM workers in check. 80% of slow WordPress VPS issues are fixed right here. If you need a fully scalable, pre-configured environment optimized for high traffic, setting up a high-performance WordPress VPS eliminates most generic software configuration bottlenecks.
- Node.js API — use PM2 or systemd for process management, cap memory per process, cache frequent DB queries in Redis, use a reverse proxy (Nginx) for TLS termination.
- Trading bot / Forex VPS — latency matters more than raw power. Pick a datacenter close to your broker's servers, use NVMe for state persistence, and keep the OS minimal. Running your financial operations within a specialized Forex VPS minimizes execution slippage by ensuring ultra-low network latency paths.
- Game server — CPU single-thread performance and low latency win. Disable unneeded services aggressively. Monitor packet loss religiously.
- Database-heavy app — NVMe and adequate RAM for the InnoDB buffer pool are non-negotiable. Tune queries before tuning the server.
❌ Common VPS Optimization Mistakes
When administrators attempt to clear resource constraints quickly, they frequently apply heavy configurations blindly. Below are the most common performance optimization pitfalls to avoid:
- Oversizing Worker Threads: Setting database pools or PHP process workers too high can easily trigger the Out-of-Memory (OOM) killer, which abruptly stops critical system processes.
- Disabling the Firewall: Disabling standard filters to temporarily eliminate CPU networking overhead leaves your server open to massive malicious probing, causing high long-term resource exploitation.
- Ignoring Disk Space Fill Levels: Forgetting that filesystems slow down exponentially as they cross 85% capacity leads to extreme storage write delays, regardless of hardware efficiency.
🚀 Ready for better VPS performance?
Use this guide to squeeze everything out of your current VPS. Diagnose the bottleneck, apply the highest-impact fixes, measure the result, and only then consider an upgrade. That order matters. To get affordable entry-level configurations for development sandboxes, you can explore specialized options like cheap VPS hosting without compromising root administrative access privileges.
If you've done the work and your server is still hitting its ceiling, it's time for faster infrastructure. Explore NVMe VPS plans for I/O-heavy workloads, Linux VPS hosting for flexibility, or cloud VPS if you need to scale on demand. And if you'd rather not handle tuning yourself, managed hosting takes that weight off your plate.
Final tip: Track one set of metrics before your changes and one after. Without that, you can't prove improvement — and you can't learn which fixes actually worked for your specific workload.
.jpg)
Co-founder with 13+ years of experience, I have played an integral part in our company's growth and success. Having developed strategic plans, secured funding, and managed teams. My involvement extends to overseeing operations, product development, and industry representation, reflecting my versatile role in the business and commitment to its continued prosperity.