
If you're asking how to optimize VM performance, start with one rule: measure first, tweak second. A slow VM usually comes down to one of four things — CPU contention, memory pressure, storage latency, or host-level contention. Once you know which one is hurting, the fixes get much simpler.
To optimize VM performance, start by identifying the bottleneck: CPU, memory, storage, or host contention. Then right-size vCPU and RAM, reduce swap usage, move workloads to SSD or NVMe storage, remove unnecessary snapshots, install optimized drivers, and monitor metrics like CPU ready time, disk latency, and memory pressure.
Before you touch anything, make sure you have admin access, basic metrics from the guest OS, a recent backup plan, and a clear idea of the workload type. A database VM and a dev box don't fail the same way.
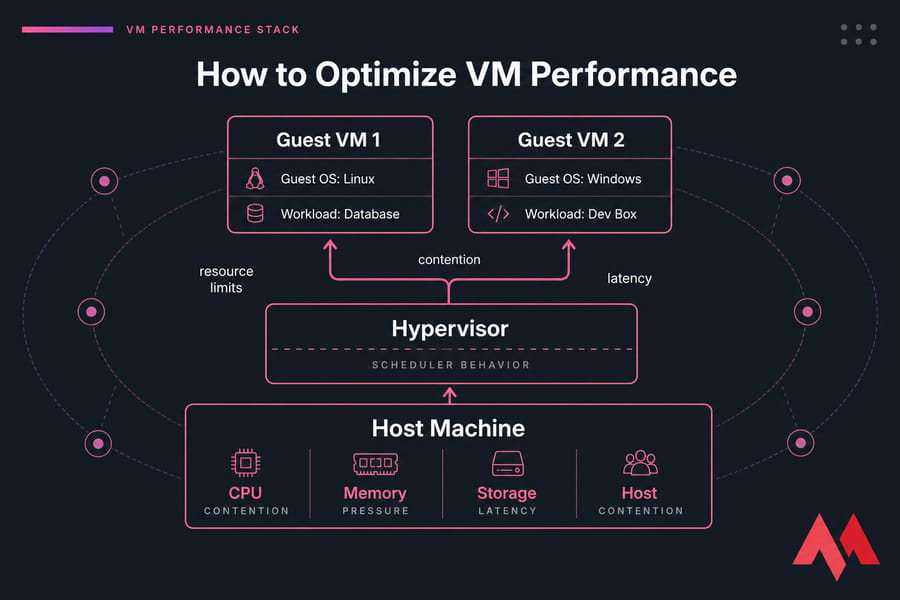
VM performance optimization really means improving responsiveness, throughput, and stability under load. That includes guest OS tuning, but also the parts people forget: the hypervisor, the host machine, shared storage, and scheduler behavior. This guide applies to Linux and Windows VMs running on KVM, VMware, Hyper-V, or even VirtualBox in smaller setups. To fully understand what lies beneath these allocations, you must evaluate the core architecture of your hypervisor environment.
If you need a refresher on the basics, see what is a VM. Knowing the clear vm vs vps structural distinction also helps you grasp whether the resource limits are under your hypervisor control or governed strictly by a parent hosting platform.
🔍 Why a Virtual Machine Is Slow
Most slow VMs aren't “generally slow.” They're bottlenecked somewhere specific. And yes, I've seen plenty of admins throw more RAM at a storage problem and lose half a day.
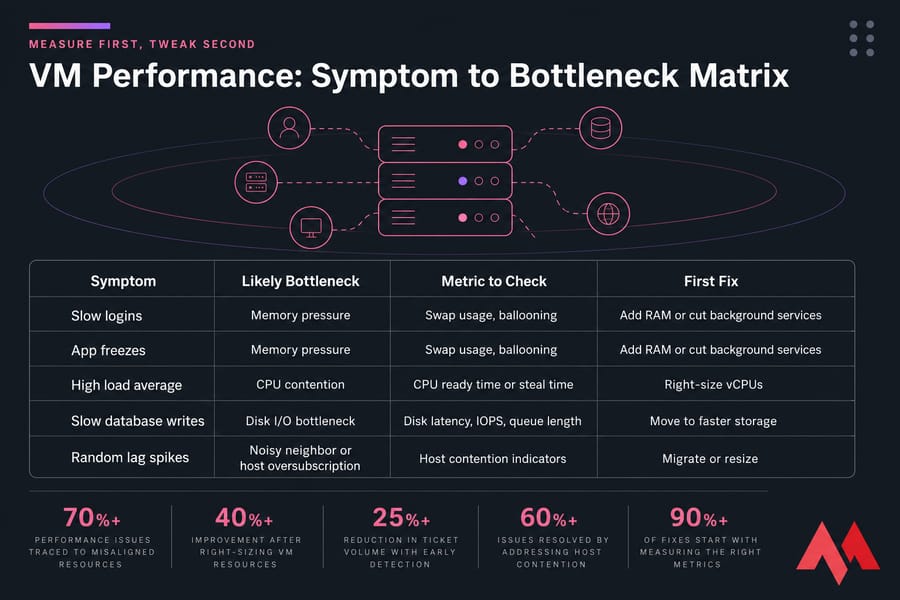
| Symptom | Likely Bottleneck | Metric to Check | First Fix |
|---|---|---|---|
| High CPU usage and lag | CPU contention | CPU ready time or steal time | Right-size vCPUs |
| System pauses under load | Memory pressure | Swap usage, ballooning | Add RAM or cut background services |
| Slow writes, DB stalls | Disk I/O bottleneck | Disk latency, IOPS, queue length | Move to faster storage |
| Unpredictable performance | Noisy neighbor or host oversubscription | Host contention indicators | Migrate or resize |
CPU issues usually show up as high utilization, high load, or rising vm CPU ready time. That's the period a VM waits for physical CPU access. More vCPUs can actually make this worse if the host scheduler struggles to place them.
Memory problems are different. You get swap activity, balloon driver pressure, sluggish logins, and apps that pause instead of crash. One common example: a web server VM with 2 GB RAM, PHP workers stacking up, and swap constantly active. It “works,” but every page feels sticky.
Storage is often the real villain. High vm disk latency, weak IOPS, and deep disk queues will wreck databases and write-heavy apps. I see this a lot on thin-provisioned or crowded shared storage. If your app waits on disk, extra CPU won't save it.
For related signs, MonoVM has a good breakdown of why a VPS gets slow.
And yes, network can hurt app response time too, especially on chatty apps or remote databases, but for core VM slowness, CPU, RAM, disk, and host load are the main suspects.
📊 How to Check VM Performance Bottlenecks First
You need a baseline. No baseline, no proof that your change helped.
Start with the core VM monitoring metrics: CPU usage, CPU ready or steal time, memory use, swap, disk latency, IOPS, queue length, and load average. You're trying to answer one question: what is saturated while users feel pain? Identifying exact system strains avoids costly trial-and-error configurations.
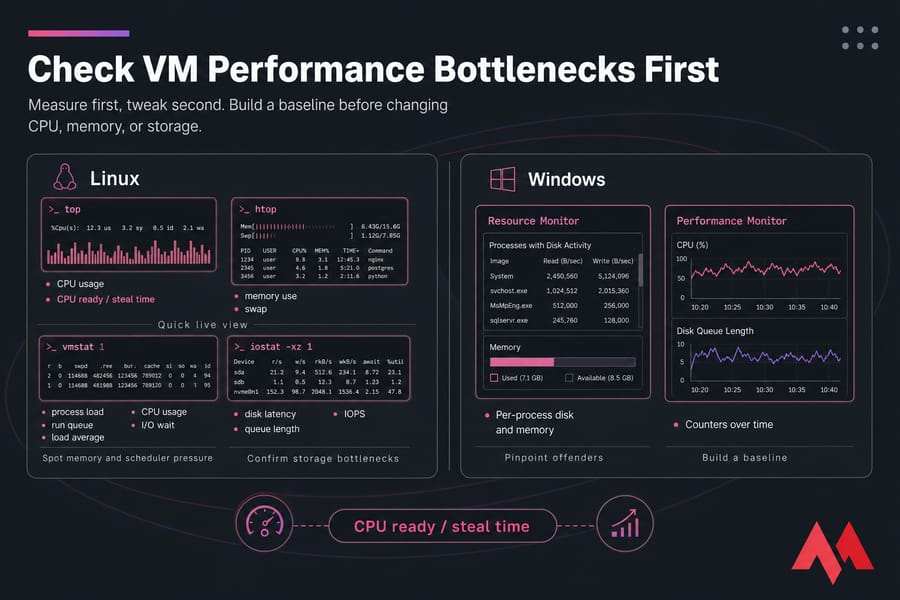
| Platform | Tool | Metric | Best Use |
|---|---|---|---|
| Linux | top / htop | CPU, memory, process load | Quick live view |
| Linux | vmstat | Swap, run queue, I/O wait | Spot memory and scheduler pressure |
| Linux | iostat | Disk latency, utilization, queue | Confirm storage bottlenecks |
| Linux | sar | Historical CPU, memory, I/O | Trend analysis |
| Windows | Task Manager | CPU, RAM, disk | Fast overview |
| Windows | Resource Monitor | Per-process disk and memory | Pinpoint offenders |
| Windows | Performance Monitor | Counters over time | Build a baseline |
Quick interpretation:
- If CPU is busy but ready/steal stays low, the guest is using what it has.
- If CPU ready climbs, the host is struggling to schedule your VM.
- If RAM looks full but swap is quiet, that may be normal cache use.
- If swap keeps growing, memory pressure is real.
- If CPU is moderate but iowait and disk latency are high, storage is the bottleneck.
On Linux, I usually start with htop, vmstat 1, and iostat -xz 1. If you're unfamiliar with the full interface and capabilities of interactive tools, reviewing a comprehensive guide on what is htop and what does it do will speed up your real-time command-line analysis. On Windows, Task Manager plus PerfMon gives a decent first pass. If you need platform-specific checks, MonoVM also covers Linux VM basics in its Linux virtual machine guide and Windows in its Windows virtual machine guide.
⚡ Optimize VM CPU Performance with Better vCPU Sizing
Does adding more vCPUs always help? No. Sometimes it hurts.
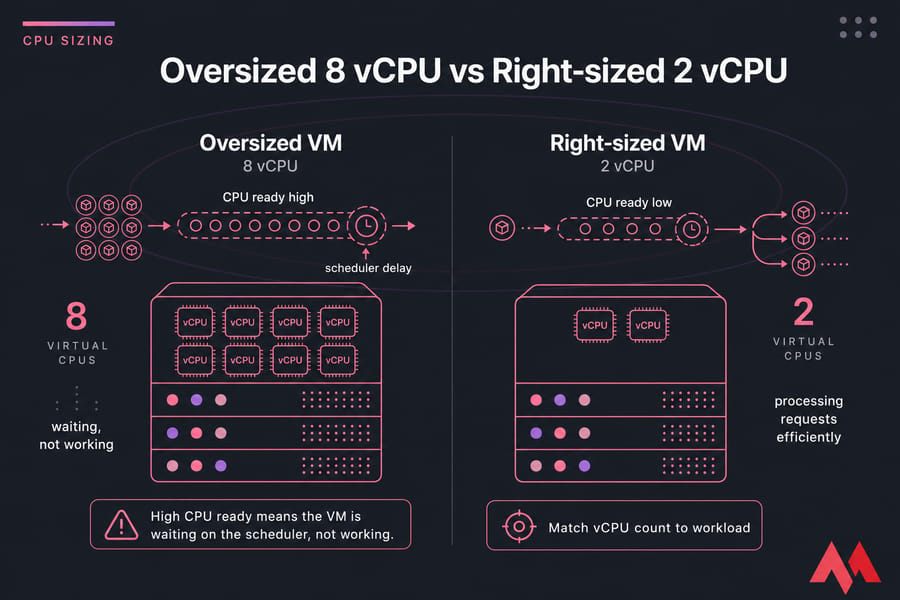
An oversized VM can suffer more scheduling delay because the hypervisor tries to find time slices for more virtual cores. That's why CPU ready matters. If ready time is high, your VM is waiting, not working. This waiting time is heavily influenced by the hypervisor core processing scheduler architecture.
- Match vCPU count to the workload profile, not your wish list.
- For lightly threaded apps, faster cores beat more cores.
- Avoid heavy CPU overcommit on busy hosts.
- Watch for sustained contention, not one short spike.
Mini-example: I once saw a small app server assigned 8 vCPUs on a crowded host. Dropping it to 4 reduced scheduling delay and improved response time. Weird? A little. Common? Absolutely.
🧠 Improve VM Memory Performance and Reduce Swap
If CPU isn't the issue, memory pressure is usually next. Swapping destroys responsiveness because the VM starts reading and writing memory pages to disk. On Windows, think page file. Same pain, different label. To better master this subsystem, understanding the core dynamics of what is virtual memory helps system admins prevent heavy storage thrashing.
Memory ballooning is another trap. The balloon driver lets the hypervisor reclaim guest memory. Helpful on paper, but if the host is tight on RAM, guests can get squeezed and slow down fast.
- Size RAM for the workload: web server, desktop, database, CI runner — all different.
- Don't disable swap blindly; reduce the need for it.
- Trim idle services, agents, and startup junk.
- If swap is sustained during normal load, add RAM.
Mini-example: a web VM with constant swap wasn't “underpowered” everywhere. It just had too many workers and logging agents running. Reducing background processes fixed half the issue before a RAM upgrade fixed the rest.
💾 Improve Virtual Machine Storage Performance
This is where a lot of virtual machine slow fix attempts succeed or fail. Storage latency hits everything.
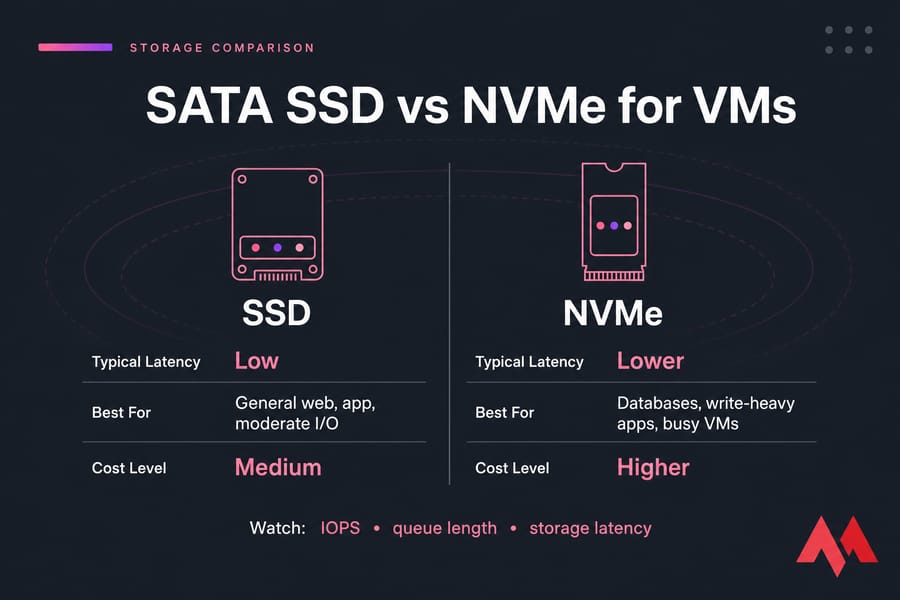
| Storage Type | Typical Latency | Best For | Cost Level |
|---|---|---|---|
| SSD | Low | General web, app, moderate I/O | Medium |
| NVMe | Lower | Databases, write-heavy apps, busy VMs | Higher |
Watch IOPS, queue length, and storage latency together. A database VM with okay CPU and RAM but 25 ms write latency will still crawl. I've seen that exact pattern on shared storage backends. The fix wasn't tuning MySQL. It was moving the VM to faster disks. System administrators aiming for top performance can learn how to upgrade their environments by inspecting the technical steps of VPS HDD to SSD migration options.
Use TRIM/UNMAP where supported, keep the guest filesystem healthy, and don't ignore shared storage contention. For a deeper storage comparison, check NVMe vs SSD. If your workload is I/O-heavy, NVMe VPS hosting can make more difference than adding another core.
📸 Remove Snapshot and Disk Growth Issues
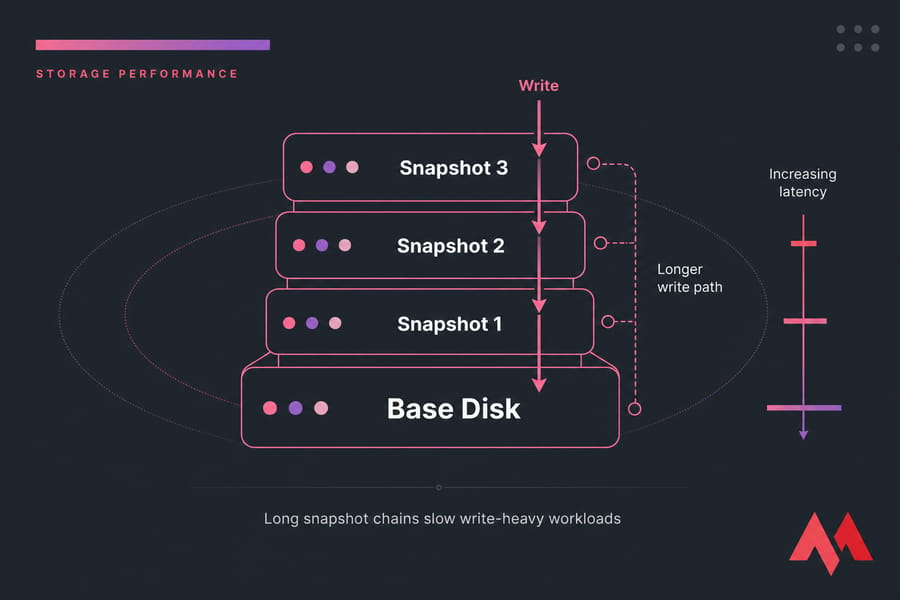
Do snapshots slow down a VM? Yes, especially long chains and write-heavy workloads. Snapshots are a short-term safety net, not a backup strategy. Use real backups for retention — MonoVM covers that here: how to backup a server or VPS.
Thin provisioning is useful, but it can surprise you with growth, fragmentation, and space pressure. Thick provisioning is more predictable, though less space-efficient. Reclaim unused guest space carefully, verify backup health first, and don't delete snapshots blindly. This part is a bit tedious, honestly, but it matters.
⚙️ Tune the Guest OS and Reduce Host Contention
After the obvious bottlenecks, tune the guest. Update paravirtual drivers like virtio, VMware Tools, Hyper-V integration components, or Guest Additions. Remove unnecessary startup services. Use sane power profiles. Patch the OS and kernel responsibly.
- Linux: remove unused packages, trim daemons, check swappiness, keep kernel and virtio components current.
- Windows: review startup apps, tune antivirus exclusions carefully, update integration tools, watch page file behavior.
Then look above the guest. KVM, VMware ESXi, Hyper-V, and VirtualBox all handle scheduling and devices differently. When selecting your underlying virtualization infrastructure, analyzing architectural face-offs like VMware vs Hyper-V or looking into hypervisor isolation metrics helps ensure consistent delivery. For bigger VMs, NUMA awareness matters. Paravirtual drivers matter too. And sometimes the host is simply overloaded.
If guest tuning changes very little and contention metrics stay high, the host is probably the bottleneck. Read up on KVM virtualization and what is a hypervisor if you want the architecture side without getting buried in vendor docs. For shared environments, a well-isolated KVM VPS hosting plan usually gives more predictable performance than bargain-tier oversubscribed setups.
📈 Benchmark, Avoid Mistakes, and Know When to Upgrade
Benchmark before and after changes. Use sysbench for CPU and memory, fio for storage, and PerfMon for Windows counters over time. Synthetic tests aren't the whole truth, but they're useful when paired with application response times. MonoVM's list of VPS benchmark tools is a good place to start. For teams looking to set up comprehensive reporting metrics across their virtual fleets, adopting professional vps monitoring tools will keep performance visibility constant and proactive.
Common mistakes? Overallocating vCPU, ignoring storage latency, keeping stale snapshots, checking only guest metrics, skipping backups, and chasing 100% utilization instead of actual throughput and latency. Also, don't gut security for speed keep virtual machine security best practices in the loop.

So when should you stop tuning? If the same resource maxes out every day under normal load, upgrade. If disk latency stays high, move to better storage. If CPU ready remains elevated, reduce contention or change hosts. If your workload has outgrown the plan, look at your primary foundational infrastructure options, which might require a step up to professional VPS server packages or localized deployment tiers. For specialized operating needs, assessing premium Linux VPS configurations or specialized Windows VPS enterprise servers will clear hardware-level bounds instantly. Look at VM Hosting, NVMe VPS hosting, or MonoVM VPS hosting. Full root access, KVM-based virtualization, and 25+ global locations are genuinely useful when performance and placement matter.
⚠️ Common VM Performance Mistakes to Avoid
Even seasoned infrastructure specialists fall into deep traps during ongoing optimization loops. Avoiding these foundational missteps keeps your virtual machines healthy:
- The "More is Better" Fallacy: Over-allocating vCPU cores blindly, causing the physical hypervisor CPU scheduler to cycle excessively while waiting to match open hardware time slots.
- Ignoring Disk Read/Write Alignment: Running demanding databases on standard arrays without confirming the underlying input/output block size configuration.
- Neglecting Integration Add-ons: Operating older production versions of hypervisor guest tools, which defaults communication pathways to slow, emulation-heavy protocols.
- Leaving Heavy Snapshots Chained: Treating temporary differential snapshot trees as permanent historical backups, which causes sequential disk seek performance to decay.

An experienced tech and developer blog writer, specializing in VPS hosting and server technologies. Fueled by a passion for innovation, I break down complex technical concepts into digestible content, simplifying tech for everyone.