![How to Check Managed VPS Resource Usage [2026] 📊](/wp-content/uploads/2026/08/how-to-check-managed-vps-resource-usage633-main.webp)
Your site's crawling, the dashboard says "everything is fine," and you're not sure whether the problem is your code, your traffic, or your plan. Learning how to check your resource usage on a Managed VPS is the fastest way to end that guessing game. It takes about five minutes and two places to look: your hosting dashboard, then the server itself over SSH.
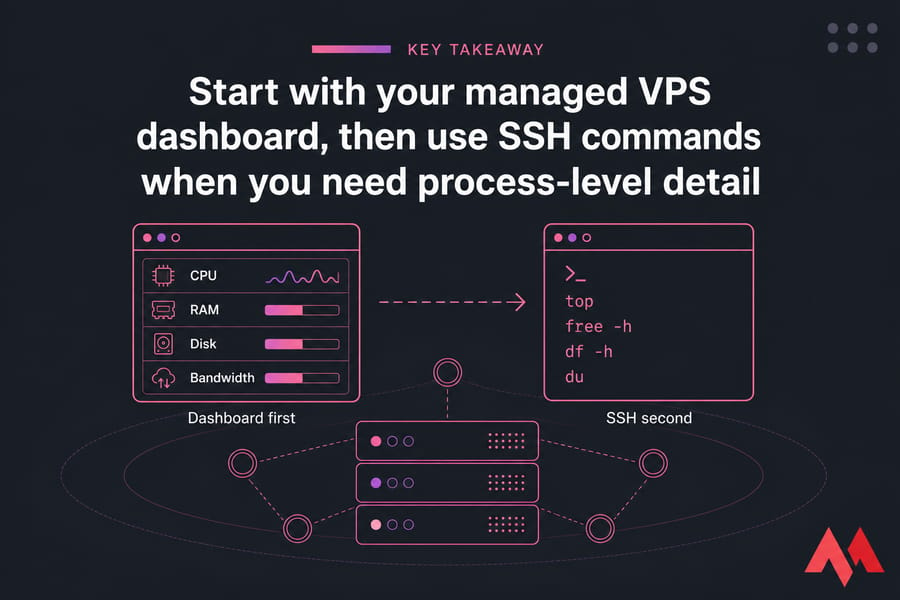
Quick answer: To check resource usage on a managed VPS, start in your hosting dashboard or control panel to view CPU, RAM, disk, and bandwidth metrics. For deeper insight, connect via SSH and run top, free -h, df -h, and du to see live usage and the processes behind it.
- Dashboard first — trends, plan limits, bandwidth
- SSH second — live CPU, memory, disk, and process detail
- Then interpret: short spike or sustained pressure?
- Then act: optimize, ask support, or upgrade
Before you start
- Access to your MonoVM client area or hosting dashboard
- Your VPS login details (root or a sudo user)
- SSH access, for Linux-based managed VPS plans
- Control panel access if you have one — cPanel, Plesk, or DirectAdmin
- Basic terminal familiarity helps, but every command below is read-only and safe
What's covered: what resource usage means, the dashboard method, CPU, memory, disk, processes, a tool comparison, how to read the numbers, and what to do next.
What managed VPS resource usage actually includes
Your VPS plan gives you a fixed slice of a physical machine. Resource usage is simply how much of that slice you're actually consuming right now — and over time.
Five metrics do most of the heavy lifting:
- CPU — processing power. Measured as a percentage of your allocated cores.
- RAM (memory) — working space for your apps, database, and cache.
- Disk space — storage for files, databases, logs, backups, and email.
- Disk I/O — how fast data moves to and from storage. Often the hidden bottleneck.
- Bandwidth / network — data transferred in and out, usually capped monthly.
There's a sixth one that trips up beginners: load average. It's a Linux-specific number showing how many processes are running or waiting. Roughly speaking, a load average equal to your core count means the server is fully busy but keeping up. Double that, and things are queuing.
One distinction worth burning into memory: allocated resources are what your plan promises. Used resources are what you're consuming. A 4 GB VPS sitting at 3.9 GB used isn't broken — but it has no headroom left for a traffic spike. If you're still getting oriented with the platform side of things, our guide on how to manage your VPS server covers the surrounding workflow.

Let's start with the quickest method: your dashboard.
The fastest way to check VPS resource usage in your dashboard
On a managed VPS, the client area is your first stop — not the terminal. It's read-only, you can't break anything, and it usually shows you the one thing SSH can't: usage over the past days or weeks.
The general workflow looks like this:
- Log in to your hosting client area and open your VPS service.
- Find the server management or statistics view for that VPS.
- Look at the CPU, memory, disk, and bandwidth graphs.
- Compare current usage against your plan's allocation.
- Note the shape of the graph — flat and high, or spiky?
If you have a control panel installed, you get a second view. cPanel VPS setups show per-account resource stats through WHM, Plesk has a server health monitor, and DirectAdmin exposes system info and per-user disk and bandwidth counters. Not every panel shows the same metrics, so poke around. Our walkthrough on how to use and manage the hosting control panel helps if the interface is unfamiliar.

Dashboards are great for trends, spike detection, and confirming you're near a plan ceiling. They're weaker on two fronts: they often poll every few minutes (so brief spikes vanish), and they almost never tell you which process caused the spike. That's where SSH comes in.
How to check CPU usage on a VPS with safe Linux commands
Connect over SSH, then start with the classic:
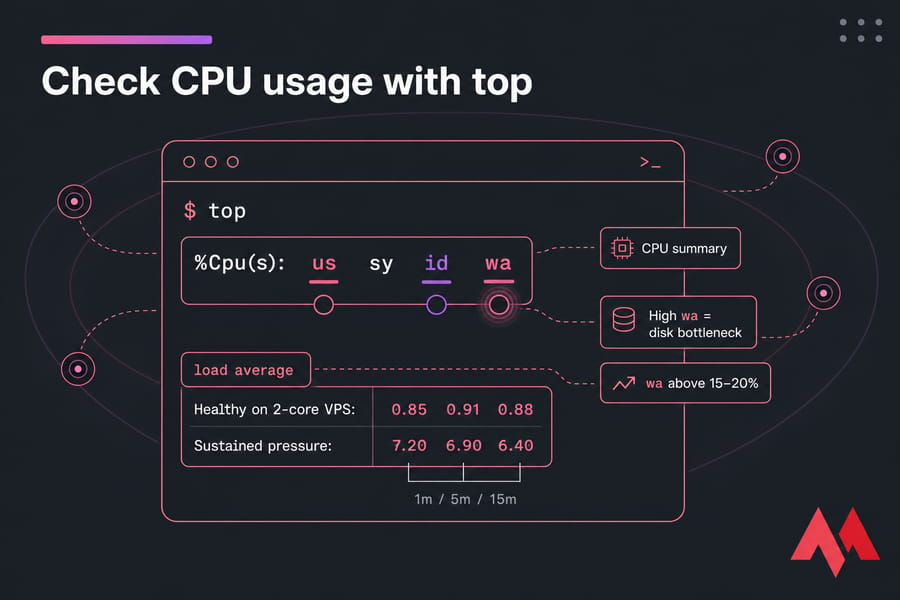
topRead the third line. It splits CPU time into us (user — your apps), sy (system — the kernel), id (idle), and wa (I/O wait). If idle is near zero and user is near 100, you're CPU-bound. If wa is high — say above 15–20% — your CPU is fine and your disk is the bottleneck. That single number solves a surprising number of "my VPS is slow" tickets.
Press q to quit. Nothing you did changed anything.
htop for a clearer view
htopSame data, colour-coded, with per-core bars and easy sorting. It's not always preinstalled — on Ubuntu or Debian run sudo apt install htop, on AlmaLinux or Rocky use sudo dnf install htop. Worth the ten seconds. If you want the full tour, we've written about what htop is and what it does.
uptime for load average
uptimeYou'll get three numbers: 1-minute, 5-minute, and 15-minute load averages. Compare them to your core count. On a 2-core VPS, a reading like 0.85 0.91 0.88 is healthy. Something like 7.20 6.90 6.40 means processes have been queuing for a quarter of an hour — that's real, sustained pressure, not a blip.
Pro tip: CPU hitting 100% for a few seconds during a cron job or a backup is completely normal. It's the flat-line-at-the-ceiling pattern that hurts. For more depth, see our guide on how to check Linux CPU usage.
How to check memory usage on a VPS and understand RAM pressure
CPU is only half the picture. A memory-starved VPS can look completely idle while every page request crawls.
free -hYou'll see columns for total, used, free, shared, buff/cache, and available. Here's the part most beginners get wrong: ignore the "free" column. Linux deliberately fills unused RAM with cached file data to speed things up. Low "free" is normal and healthy.
The column that matters is available — memory the kernel can hand to a new process immediately, reclaiming cache if needed. On a 4 GB VPS, 1.5 GB available is comfortable. 120 MB available is a warning.
Then check the swap row:
- Swap at zero or near-zero: fine.
- Swap steadily climbing: the server is spilling memory to disk, which is dramatically slower than RAM. Expect timeouts.
- Swap full and available RAM near zero: you're one traffic burst away from the kernel killing a process (usually MySQL — always MySQL).
The usual RAM consumers on a web VPS are MySQL/MariaDB, PHP-FPM worker pools, Node.js apps, and caching layers like Redis or Memcached. Oversized PHP-FPM pools are the single most common cause I see on small VPS plans. Our deeper article on how to check Linux memory usage breaks down each column.

How to check disk usage on a VPS before storage becomes a problem
Start with filesystem-level usage:
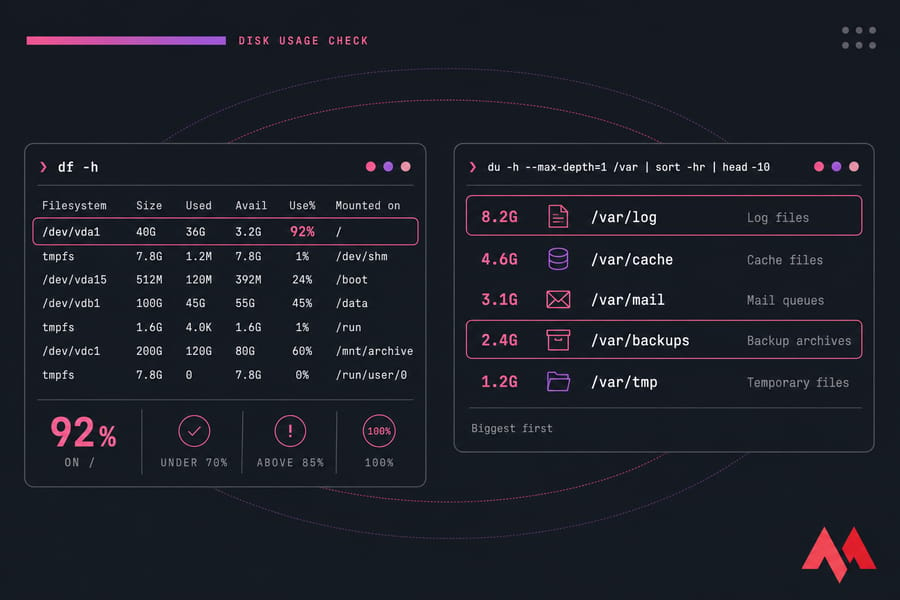
df -hLook at the / mount point and its Use% column. Under 70% is comfortable. Above 85%, plan cleanup. At 100%, things break in confusing ways — MySQL refuses writes, logs stop, package updates fail, and sessions die. A full disk masquerades as a dozen unrelated bugs.
Then hunt for the culprit:
du -h --max-depth=1 /var | sort -hr | head -10That gives you the ten largest directories under /var, biggest first. Repeat for /home and /root. The usual offenders: old backup archives nobody deleted, runaway log files in /var/log, cache directories, mail queues, and years of media uploads.
Don't forget inodes
df -iInodes are file-count slots. You can exhaust them while still having gigabytes free — typical when a session directory or a mail spool accumulates millions of tiny files. If df -h looks fine but writes are failing, check this.
Example: if df -h shows 92% on /, clear old logs and stale backups first, then look at caches. Our guides on how to check disk space in Linux and back up a server or VPS cover the cleanup and retention side.
How to find the processes causing high resource usage
Numbers tell you what. Processes tell you who.
ps aux --sort=-%cpu | head -10
ps aux --sort=-%mem | head -10
Top ten by CPU, then top ten by memory. Names you'll recognise: apache2 or nginx, mysqld, php-fpm, node, rsync, or a cron-launched script.
Now map them to reality:
- Dozens of php-fpm processes at high CPU — real traffic, aggressive bots, or a heavy plugin.
- mysqld eating memory — missing indexes, slow queries, or a buffer pool set too large for the plan.
- rsync or tar spiking at 3 a.m. — your backup job. Usually harmless, sometimes worth rescheduling.
- An unfamiliar script at 100% CPU — investigate before touching anything.
Warning: don't kill processes you can't identify on a managed VPS. Terminating mysqld mid-write, or a service your panel depends on, causes bigger problems than the slowdown you were chasing. If you do need to stop something, our guides on the Linux process list and the kill process command explain how to do it properly.
Dashboard vs SSH vs external monitoring tools
| Method | Best for | Skill level | Real-time? | Process detail? |
|---|---|---|---|---|
| Hosting dashboard / control panel | Trends, plan limits, bandwidth | Beginner | Near real-time | No |
| SSH commands (top, free, df, ps) | Live debugging, finding the culprit | Beginner to intermediate | Yes | Yes |
| External stack (Prometheus + Grafana) | History, alerting, multi-server views | Intermediate to advanced | Yes | Yes, with exporters |
For most managed VPS customers, dashboard plus a handful of commands covers 90% of situations. You don't need a full observability stack on day one — that's a project, not a diagnosis.
But if you're running production apps where a 3 a.m. memory leak costs you money, alerting is worth building. Start with our roundup of VPS monitoring tools, then move to Prometheus and Grafana on a VPS when you want dashboards with history. For everything else in the admin toolbox, our list of VPS server management tools is a good bookmark.
How to tell whether high usage is actually causing your slowdown
This is where most tutorials stop and users stay stuck. A number being high isn't proof it's the problem.
| Symptom | Metric to check | Likely cause | Next step |
|---|---|---|---|
| Pages slow under traffic, CPU pinned | top, uptime | CPU-bound app or bot traffic | Cache, block bots, or add cores |
| Random timeouts, CPU normal | free -h | Low available RAM, swapping | Tune PHP-FPM/MySQL or add RAM |
| Uploads and writes failing | df -h, df -i | Disk or inodes full | Clear logs and old backups |
| Everything sluggish, high wa in top | top, vmstat, iostat | Disk I/O bottleneck | Reduce writes, move to faster storage |
| Load average high, CPU idle | uptime, ps aux | Processes blocked on I/O or locks | Check database locks and backup jobs |
| Slow at fixed times daily | crontab, ps aux | Scheduled job overlap | Stagger cron schedules |
Rough thresholds worth respecting: sustained CPU above 80% for hours, available RAM consistently under 10% of total, disk above 85–90%, and load average persistently above your core count. One of those for ten minutes is noise. All week is a pattern.
If your server is slow and none of this lines up, our articles on why a VPS runs slow and how to troubleshoot Linux VPS issues go through the less obvious causes.
What to do when your managed VPS is using too many resources
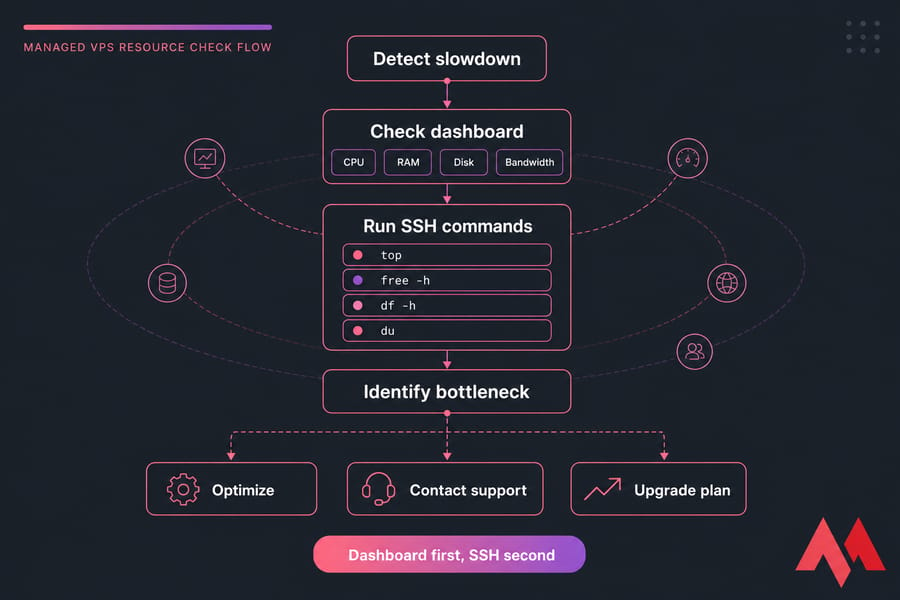
Once you know the bottleneck, the fix gets obvious. Work through this in order.
Safe things to try first
- Delete old backup archives and rotate oversized logs
- Review plugins, extensions, and unused services
- Enable caching — object cache, page cache, or OPcache
- Reduce cron frequency where every-minute jobs aren't needed
- Optimize slow database queries and add missing indexes
- Restart a genuinely stuck service, if you know which one it is
Our guide on how to improve VPS performance covers the tuning side in detail.
When to open a support ticket
Contact support when spikes have no visible cause, when outages repeat on a schedule you can't explain, when panel metrics contradict what users are experiencing, or when you'd rather not experiment on a live server. That's the whole point of managed hosting — you get someone to look at the stack with you. If you're weighing that trade-off, our comparison of a managed or unmanaged server is a useful read.
When upgrading is the right call
Upgrade when usage is sustained rather than spiky, when you've already trimmed the obvious waste, when seasonal traffic keeps pushing you to the ceiling, or when your app simply grew past its allocation. Adding RAM to a VPS is cheaper than a week of debugging.
Need a hand reading your numbers?
If your server is slow and the metrics don't clearly point at the cause, MonoVM's managed hosting solutions include hands-on help identifying bottlenecks, reviewing usage trends, and deciding whether tuning or a bigger plan makes more sense. Support runs 24/7.
And if CPU, RAM, or storage is consistently near its limit, it's time to size up. Compare VPS hosting plans or go straight to Linux VPS hosting with managed support and global locations.

An experienced tech and developer blog writer, specializing in VPS hosting and server technologies. Fueled by a passion for innovation, I break down complex technical concepts into digestible content, simplifying tech for everyone.