
Monitoring a server after it breaks is a bad habit. Setting up Prometheus and Grafana monitoring on a VPS takes about 30 minutes and gives you the CPU, RAM, disk, and uptime history you'll wish you had the next time something goes sideways.
Here's the short version: install Prometheus, Node Exporter, and Grafana on Ubuntu, configure Prometheus to scrape your server metrics, then connect Grafana to Prometheus and import a dashboard. That's the whole game.
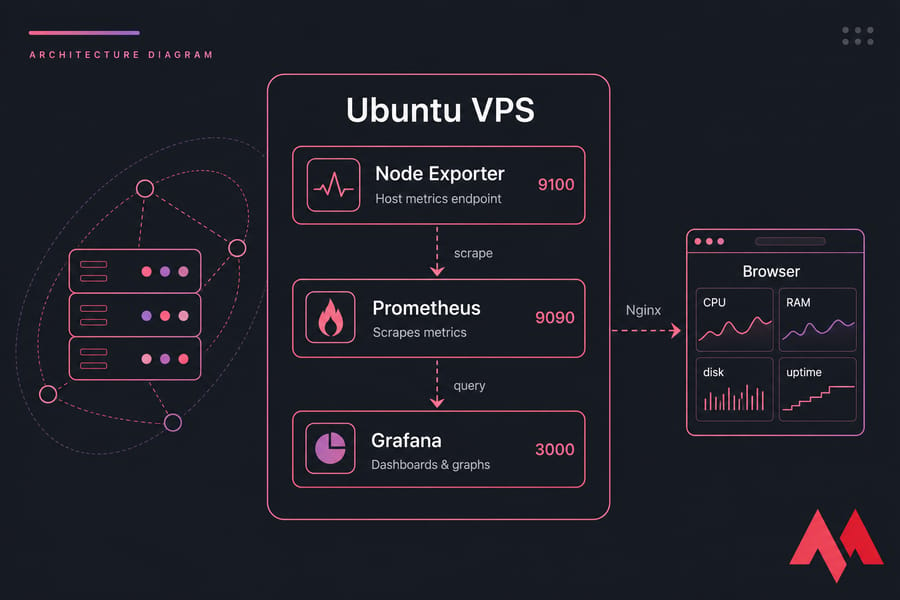
Why Prometheus and Grafana suit VPS monitoring
Prometheus is a time-series database that pulls (scrapes) numeric metrics from HTTP endpoints on a schedule. Grafana draws those numbers as graphs. Node Exporter is the small agent that exposes Linux host metrics so Prometheus has something to scrape.
Why self-host it instead of using a SaaS agent? Three reasons I keep coming back to: no per-host billing, no data leaving your box, and exporters for basically everything — Nginx, MySQL, PostgreSQL, Redis, Docker. If you're still comparing options, our roundup of VPS monitoring tools covers the alternatives.
Even plain CPU, memory, and disk graphs catch bottlenecks before they turn into outages. I've traced more than one "random slowdown" to a disk that quietly filled to 97%.
Prerequisites
You'll want an Ubuntu 22.04 or 24.04 VPS, a sudo user, and SSH access. If you're unsure how to get in, start with our guide on how to connect to your VPS. Run a quick update first.
sudo apt update && sudo apt upgrade -yResource-wise: 1 vCPU and 1 GB RAM technically works for a single node, but 2 vCPU / 2–4 GB is what you actually want once retention grows. Prometheus writes constantly, so a Linux VPS with dedicated RAM and NVMe storage beats an oversold shared box every time.
| Component | Port | Purpose | Exposure |
|---|---|---|---|
| Prometheus | 9090 | Scraping, query API, targets UI | Private / localhost |
| Node Exporter | 9100 | Host metrics endpoint | Private / localhost |
| Grafana | 3000 | Dashboard web UI | Public via Nginx + HTTPS |
Confirm nothing else is already sitting on those ports — here's how to check open ports in Linux.
Install Prometheus on Ubuntu VPS
Grab the current release URL from prometheus.io/download rather than trusting a version string in a blog post (including this one).
1. Create a service account and directories:
sudo useradd --no-create-home --shell /bin/false prometheus
sudo mkdir /etc/prometheus /var/lib/prometheus
2. Download, extract, and place the binaries:
tar xvf prometheus-*.linux-amd64.tar.gz
cd prometheus-*.linux-amd64
sudo cp prometheus promtool /usr/local/bin/
sudo cp -r consoles console_libraries /etc/prometheus/
sudo chown -R prometheus:prometheus /etc/prometheus /var/lib/prometheus
3. Write /etc/prometheus/prometheus.yml. A scrape target is just a host:port that Prometheus polls:
global:
  scrape_interval: 15s

scrape_configs:
  - job_name: 'prometheus'
    static_configs:
      - targets: ['localhost:9090']
4. Create /etc/systemd/system/prometheus.service:
[Unit]
Description=Prometheus
After=network-online.target

[Service]
User=prometheus
Group=prometheus
Type=simple
ExecStart=/usr/local/bin/prometheus \
  --config.file=/etc/prometheus/prometheus.yml \
  --storage.tsdb.path=/var/lib/prometheus/ \
  --storage.tsdb.retention.time=30d \
  --web.console.templates=/etc/prometheus/consoles \
  --web.console.libraries=/etc/prometheus/console_libraries

[Install]
WantedBy=multi-user.target
sudo systemctl daemon-reload
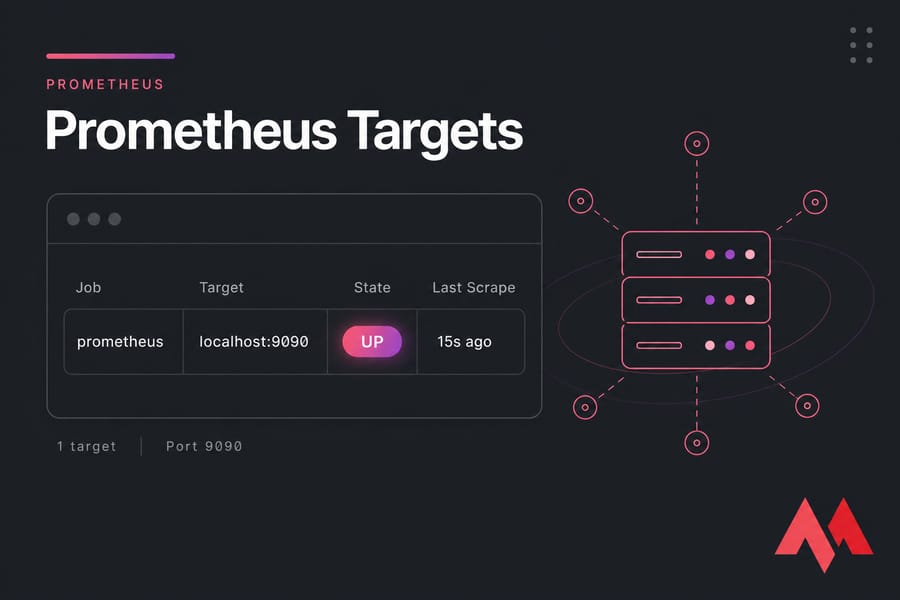
sudo systemctl enable --now prometheusExpected result: visit http://YOUR_IP:9090/targets and you should see one target with state UP. Run a dedicated user and a systemd unit — never a binary in a screen session. Trust me on that one.
Node Exporter install for host metrics
Without Node Exporter, Prometheus only monitors itself. Useless. Install it the same way:
sudo useradd --no-create-home --shell /bin/false node_exporter
sudo cp node_exporter /usr/local/bin/
sudo chown node_exporter:node_exporter /usr/local/bin/node_exporter
Create /etc/systemd/system/node_exporter.service with the same shape as before, using ExecStart=/usr/local/bin/node_exporter --web.listen-address=127.0.0.1:9100 if Prometheus lives on the same box. Binding to localhost means port 9100 is never publicly reachable.
sudo systemctl daemon-reload
sudo systemctl enable --now node_exporter
Add it to prometheus.yml, then reload:
  - job_name: 'node'
    static_configs:
      - targets: ['localhost:9100']
        labels:
          instance: 'web-01'
sudo systemctl restart prometheus
curl -s localhost:9100/metrics | headExpected result: a wall of metrics starting with node_ — CPU seconds, memory bytes, filesystem usage, load averages. The node job now shows UP on the targets page.
Install Grafana on Ubuntu
Add Grafana Labs' APT repository (the exact key command lives in grafana.com/docs), then:
sudo apt install -y grafana
sudo systemctl enable --now grafana-server
Open http://YOUR_IP:3000 and log in with admin / admin. Change that password immediately — Grafana prompts you, so don't click past it.
Connect Grafana to Prometheus as a data source
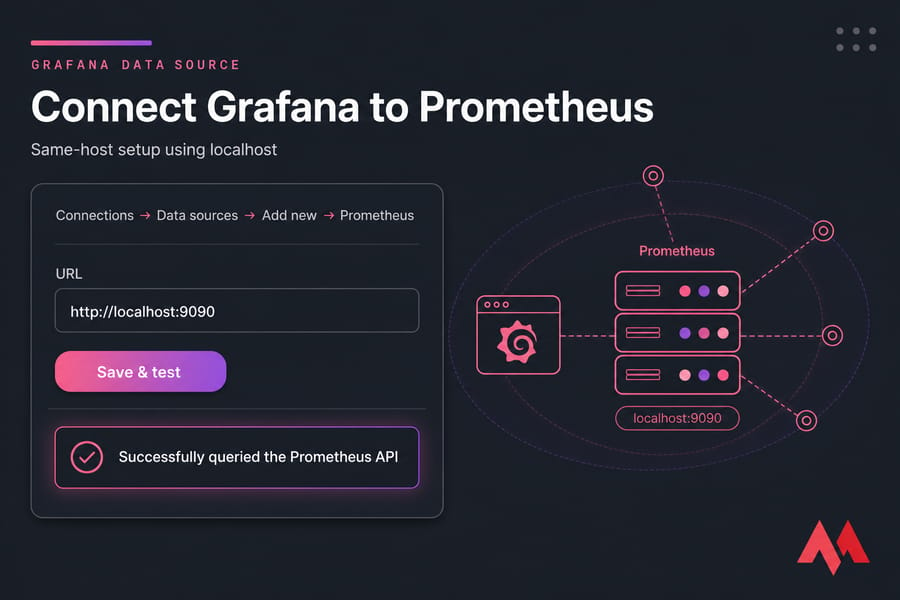
Go to Connections → Data sources → Add new → Prometheus. Set the URL to http://localhost:9090 for a same-host install, or the private IP if Prometheus runs elsewhere. Hit Save & test.
Green confirmation means your core integration works. "Connection refused" almost always means Prometheus isn't running or you used the wrong port; a timeout usually means a firewall between the two hosts.
Build or import a Grafana Prometheus dashboard
Don't hand-build panels on day one. Go to Dashboards → New → Import, enter ID 1860 (Node Exporter Full), pick your Prometheus data source, and click Import. You get roughly 200 panels instantly.
One caveat: imported dashboards expect specific job labels. If panels look empty, check that your job name matches what the dashboard's variables query.
| Metric | Why it matters |
|---|---|
| CPU usage % | Spots runaway processes and undersized plans |
| Memory used / available | Early warning before the OOM killer acts |
| Disk usage & I/O wait | Full disks and slow storage kill databases |
| Load average | Shows queued work CPU% alone hides |
| Network throughput | Catches traffic spikes and scraping bots |
| Uptime | Reveals silent reboots |
More context on what to watch in our breakdown of VM monitoring metrics, and once you spot a bottleneck, our guide to improve VPS performance covers the fixes.
Secure Prometheus and Grafana on a public VPS
Default installs listen on all interfaces with no auth on Prometheus. That's an open window into your infrastructure. Lock it down:
- Bind Prometheus and Node Exporter to 127.0.0.1 wherever possible.
- Deny 9090 and 9100 in UFW; allow only 22, 80, and 443.
- Put Grafana behind an Nginx reverse proxy on a subdomain.
- Add a Let's Encrypt certificate — see how to install SSL on a VPS.
- Disable anonymous access in grafana.ini and use a long admin password.
Expose Grafana. Keep everything else internal. Broader hardening steps live in our guide to secure your Linux VPS.
Troubleshooting
| Symptom | Likely cause | Check |
|---|---|---|
| Target DOWN | Exporter not running or wrong port | systemctl status node_exporter |
| Service won't start | YAML indentation or bad path | journalctl -u prometheus -n 50 |
| Grafana "No data" | Wrong data source URL or job label | Run a query in Grafana Explore |
| Connection refused | Nothing listening on that port | ss -tulpn | grep 9090 |
| Remote target unreachable | UFW blocking 9100 | curl IP:9100/metrics from Prometheus host |
| Permission denied in logs | Wrong directory ownership | ls -l /var/lib/prometheus |
| Graphs shifted in time | Clock drift | timedatectl status |
Still stuck? Our troubleshoot Linux VPS issues walkthrough goes deeper on log reading.
Monitoring multiple VPS instances
Install Node Exporter on each server, then add them under the node job with descriptive labels:
      - targets: ['10.0.0.11:9100', '10.0.0.12:9100']
        labels:
          env: 'production'
Past roughly five nodes, move Prometheus onto its own box so a busy app server can't starve your monitoring. Budget storage too — figure a couple of GB per node per month at 15-second intervals, which is where fast NVMe disks pay off. A dedicated Linux VPS hosting plan keeps the observability stack isolated from production workloads.
Final checklist
- Prometheus running and reachable on 9090
- Node Exporter target showing UP
- Grafana data source tested green
- Node Exporter Full dashboard populated
- UFW restricted, Prometheus bound to localhost
- HTTPS active if Grafana is public
Next up: Alertmanager for notifications, blackbox_exporter for uptime and TLS expiry checks, and service exporters for your database. If retention or dashboard load is straining the box, an NVMe VPS handles it comfortably — and if you'd rather not babysit the server layer, managed hosting covers that for you.
Launch your monitoring stack on a faster VPS — get a MonoVM Linux VPS with root access, NVMe storage, and 24/7 support.

An experienced tech and developer blog writer, specializing in VPS hosting and server technologies. Fueled by a passion for innovation, I break down complex technical concepts into digestible content, simplifying tech for everyone.