![What is htop and What Does It Do? [htop Command]](/wp-content/uploads/2020/10/20685-main.webp)
One common need when working with any operating system is the ability to easily see how system resources like CPU and RAM are being used and which processes are running in the background. Almost all operating systems provide tools to display this information, but when it comes to Linux, more advanced and precise tools are available. One of the most popular and powerful of these tools is htop, which provides clear, real-time information and gives you full control over processes. Stay with us at MonoVM as we explore how to use htop and how to customize htop in detail.
Introduction to htop
htop is an interactive process viewer designed to provide a more advanced and user-friendly look at system resource usage. It serves as a modern replacement for the classic top command. The main goal behind developing htop was to overcome the visual and interactive limitations of older tools and to better match the complex, multi-core architectures of modern systems.
htop uses colors and visual charts to quickly convey essential information, allowing you to monitor system processes in real time, sort them based on different metrics, and manage them directly. This visual approach greatly reduces the time needed to identify the source of a problem, especially in busy server environments or when the system is under heavy load.
Why Use htop Over top and other alternatives?
Your first question might be why you should move away from a tool that exists by default on every Linux system (like top) and install something new. The main reason is the significant improvement in user experience and the depth of information that htop provides. Some of the key features of htop include:
- Interactive and Colorful Interface: Unlike top, which uses a plain text interface, htop displays information using colorful and well-organized charts. The use of colors and visual graphs makes it much easier to understand CPU and memory usage at a glance.
- Easy Navigation and Control: You can move through the process list using the arrow keys (↑↓) and Page Up/Down. You can also sort columns or select a process using your mouse, and kill it by pressing k or F9.
- Tree View of Processes: htop can display processes in a tree view (using F5), allowing you to see parent-child relationships and better understand how processes depend on each other.
- Search and Filter Features: Press F3 (or /) to quickly search for process names, and F4 to filter the list based on part of a name.
- More Options and Flexibility: htop supports mouse actions, allows you to change process priority (nice value) using F7/F8, and overall provides a much more user-friendly interface for everyday monitoring tasks.
The table below shows a comprehensive comparison of htop with other popular alternatives.
|
Feature |
Htop |
Top |
Glances |
Nmon |
Atop |
|
User Interface |
Graphical & Interactive |
Text-based |
Graphical & Interactive |
Text-based |
Graphical & Interactive |
|
Ease of Use |
Very Easy |
Easy |
Moderate |
Complex |
Moderate |
|
Process Information |
Yes |
Yes |
Yes |
Yes |
Yes |
|
Network Information |
No |
No |
Yes |
Yes |
Yes |
|
Disk Information |
Limited |
No |
Yes |
Yes |
Yes |
|
Sensor Information |
No |
No |
Yes |
Yes |
Yes |
|
Change Process Priority |
Yes |
No |
No |
Yes |
Yes |
|
Resource Usage |
Moderate |
Low |
Moderate |
Moderate |
Moderate |
|
Interactive Features |
Yes |
No |
Yes |
No |
Yes |
As you can see, tools like Glances provide more extensive information (such as network usage or temperature data), but htop is extremely simple, lightweight, and perfectly suitable for quick monitoring.
Installing htop on Linux

Although top comes preinstalled on all UNIX-based systems, htop usually needs to be installed manually. Fortunately, the process is very simple and can be done easily using common package managers. You can install htop using the following commands:
On Debian or Ubuntu:
$ sudo apt install htop
On Fedora:
$ sudo dnf install htop
On Arch Linux:
$ sudo pacman -S htop
macOS (with Homebrew):
brew install htop
CentOS/RHEL (with EPEL repository enabled):
sudo yum install epel-release
sudo yum install htop
Installation Method for Professionals
In environments where you don’t have access to a package manager, or if you want to ensure access to the latest versions or specific configuration options, you may need to compile htop from source. Since htop relies on the Ncurses library to provide its visual interface, you must first install its development packages (such as libncurses5-dev).
The technical compilation process usually includes the following steps:
downloading the source file, extracting it, running the configure script to check dependencies, running make to build the binary, and finally running sudo make install to install it on the system. This approach ensures that htop remains usable even in the most restricted Linux environments.
Understanding the htop Interface
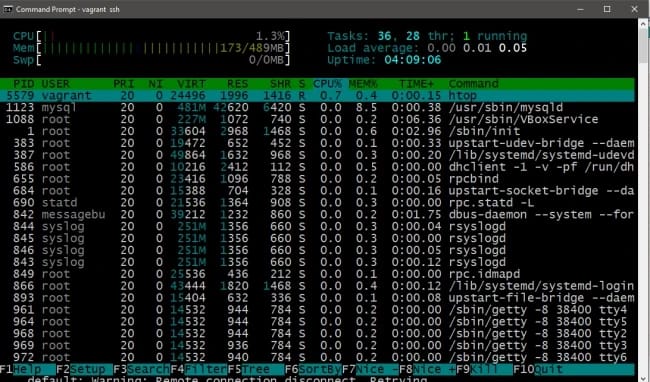
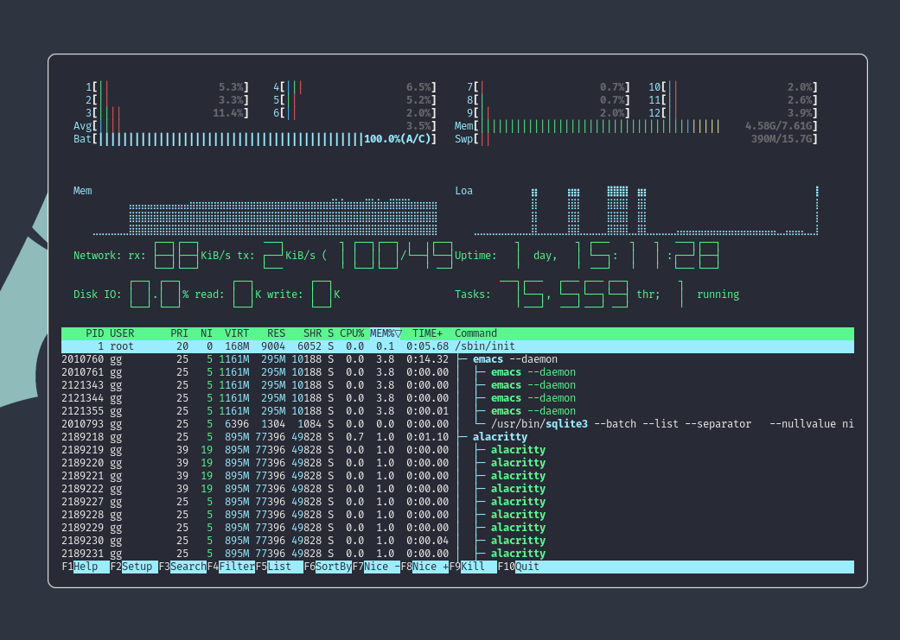
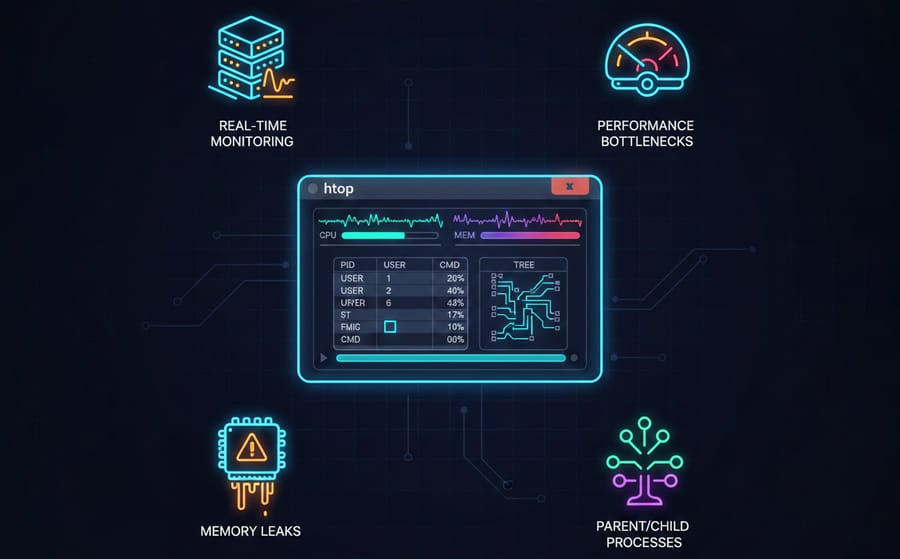
When you run htop, you see a screen with two main sections: the upper section (the header), which shows the overall system status, and the lower section, which displays the list of processes. In the image below, you can see parts of the htop output:
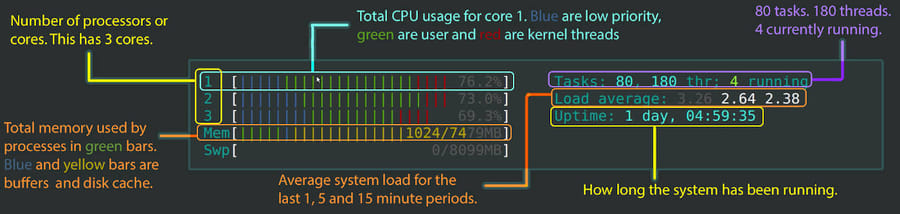
 In the image above, a graph of resource usage is shown. The upper section contains colored bars that indicate the status of the CPU, main memory (Mem), and virtual memory (Swap). You can also see the Load Average and Uptime (how long the system has been running).
The lower section is a table where each row represents a process. Each column has an explanation:
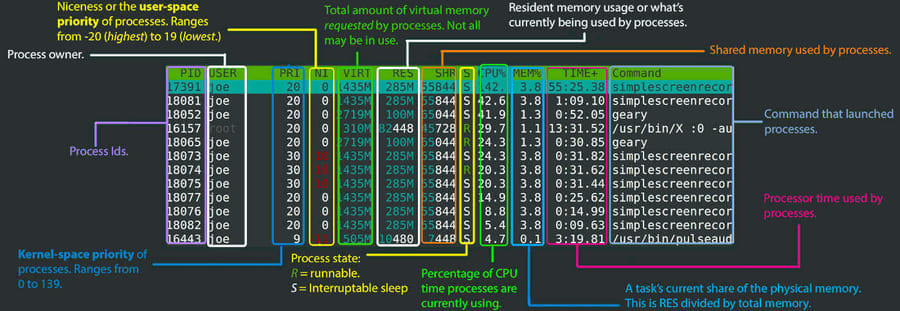
- PID: The unique identifier of the process.
- USER: The name of the user or account that launched the process.
- PRI/NI: Priority and Niceness of the process. Higher priority means more CPU time, and NI shows the niceness value.
- VIRT/RES/SHR: Virtual memory, current physical memory usage, and memory shared with other processes (respectively). VIRT is usually larger than the actual total RAM.
- S: Process State. For example, R means running, S means sleeping or waiting (Interruptible Sleep), D means uninterruptible sleep, Z means zombie (a dead process not yet removed from the process table), and T means stopped.
- CPU% and MEM%: The percentage of CPU and memory usage by the process.
- TIME+: The total CPU time consumed since the process started (minutes:seconds).
- Command: The command or program that created the process.
Note: Proper understanding of the VIRT, RES, and SHR columns is essential for diagnosing memory issues, because looking only at VIRT can be misleading.
|
Column |
Full Name |
Detailed Technical Description |
Importance in Troubleshooting |
|
VIRT |
Virtual Memory Size |
Total virtual memory mapped by the process (including code, data, shared segments, and swap). |
Not usually useful for identifying actual RAM usage. If extremely large, it may indicate heavy library mapping. |
|
RES |
Resident Memory Size |
Actual physical (non-swapped) memory used by the process. |
The most important metric: represents real RAM consumption and directly corresponds to %MEM. |
|
SHR |
Shared Memory Size |
Shared memory or libraries used jointly by multiple processes. |
A portion of VIRT that can also be used by other processes. |
This table can help you troubleshoot more effectively, but you still need proper technical knowledge to resolve issues.
Color Codes and Meters Explained
Colors in the header status bars serve as quick diagnostic tools and require careful interpretation.
a) CPU Meters: Interpreting System Load
CPU bars (on multi-core systems, one bar is shown for each core) convey important information through colors:
- Green: Normal user-level processes are running.
- Blue: Low-priority processes (Nice > 0) are running. These are tasks you have explicitly marked as lower priority.
- Red: Kernel threads are running. If this stays high for long periods, the issue may be related to kernel subsystems, drivers, or heavy system operations.
- Grey: I/O wait time. This is a serious warning. If the CPU spends a large percentage of time in grey, it means the processor is idle and waiting for I/O from disk or network. In this case, your bottleneck is storage or network.
- Orange and Magenta: Represent IRQ and SoftIRQ times, related to CPU handling hardware interrupts.
With these colors, you can understand how resources are being used at a glance.
b) Memory Meters: The Difference Between Usage and Optimization
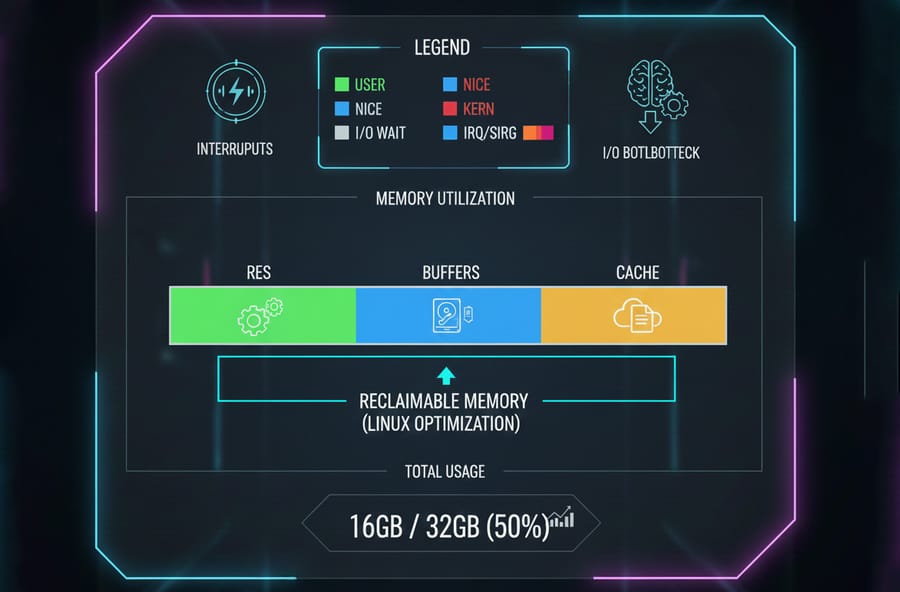
Memory bars use colors to display different types of RAM usage:
- Green: Memory actually used by processes (RES).
- Blue: Buffers. Memory used for temporarily holding I/O data.
- Yellow or Orange: Cache. Memory used by Linux to cache frequently accessed files.
You should know that the blue and orange portions are memory that Linux can free immediately. In fact, a healthy and optimized Linux system uses its free memory for file caching to improve performance. Therefore, seeing a large orange section indicates good system optimization and effective RAM usage, not a memory shortage.
The color decoding table for htop meters is provided below:
|
Metric |
Color |
Precise Technical Meaning |
Practical (Diagnostic) Explanation |
|
CPU |
Blue |
Low-Priority (Nice > 0) |
Background tasks running with low priority. |
|
CPU |
Green |
Normal (User-level processes) |
Regular workload generated by user applications. |
|
CPU |
Red |
Kernel Threads (System processes) |
The system kernel is busy with critical operations (may indicate overload). |
|
CPU |
Gray |
I/O Wait Time |
CPU is idle but waiting for disk or network I/O (indicator of storage bottlenecks). |
|
Memory |
Green |
Used Memory (RES) |
Actual RAM consumed by applications. |
|
Memory |
Blue |
Buffers |
Memory used for buffering I/O operations. |
|
Memory |
Orange |
Cache |
Memory used for file caching (releasable when needed). |
For more information, you can read the guide on interpreting htop’s color-coded graphs.
Basic Usage Guide
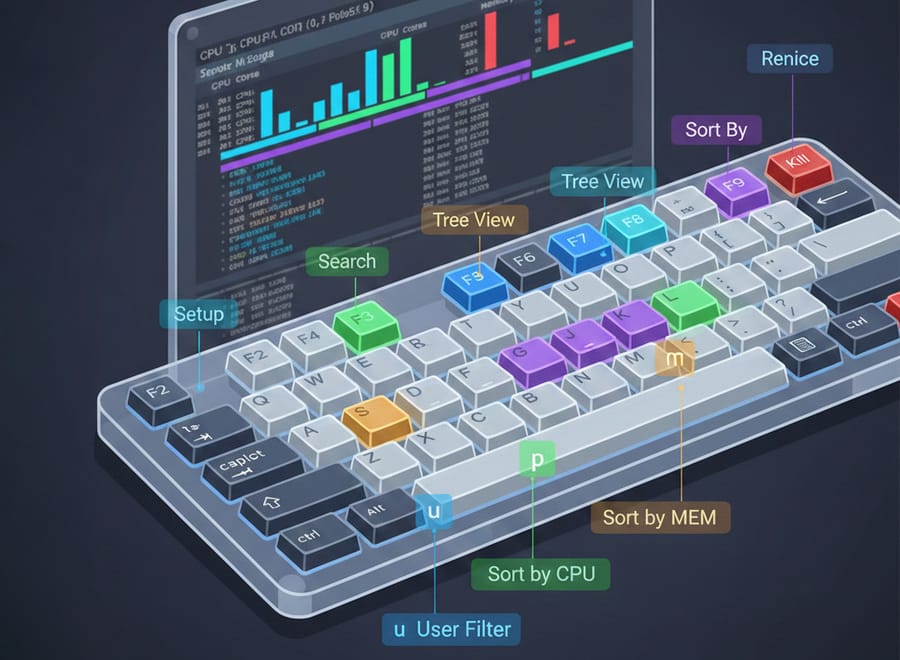
Getting started with htop is simple. After typing htop and seeing the interface, all navigation and commands are performed using the keyboard. If you need full access, make sure to run sudo htop. To exit, press F10 or Q. Navigation through the process list is done using the arrow keys. The table below shows the essential F-Key shortcuts and their functions.
|
Key |
Function |
Critical Use |
|
F2 |
Setup |
Customize meters, columns, and display options. |
|
F3 |
Search |
Search for a process by name. |
|
F4 |
Filter |
Filter processes based on a string. |
|
F5 |
Tree View |
Show hierarchical parent/child process relationships. |
|
F6 |
Sort By |
Change the sorting column for processes. |
|
F7 / F8 |
Renice |
Increase/decrease process priority (system load control). |
|
F9 |
Kill |
Terminate a process (choose a signal). |
|
u |
User Filter |
Show only processes belonging to a specific user. |
|
p / m |
Sort Shortcut |
Quickly sort by %CPU (p) or %MEM (m). |
Let’s take a closer look at the key htop functions and commands.
Starting, Navigating, and Sorting
When the process list is long, you need efficient ways to filter and sort information:
- Sorting (F6): If you want to know which processes are putting the most load on your system, sorting is essential. Press F6 to choose the column you want to sort by, such as %CPU or %MEM.
You can also press p and m to instantly sort by CPU and Memory usage. - Tree View (F5): Pressing F5 displays processes in a hierarchical (parent/child) tree. This is especially useful for analyzing child processes under a parent service (such as a web server).
These tools help you quickly spot resource-heavy processes and optimize your system’s performance.
Searching and Filtering Processes
When dealing with a long process list, fast filtering and searching becomes important:
- Search (F3): Use F3 to find a specific process using part of its name or command.
- Filter (F4): More advanced filtering is done with F4. Enter a string and htop will show only the processes matching that pattern. You can use multiple expressions separated by | (e.g., nginx|php-fpm).
- User Filter (u): Press u to filter processes by owner (User) and view only the processes belonging to a specific user.
These commands help you find the exact process you want to manage next.
Managing Priority and Killing Processes
Process management in htop is very intuitive. Two main actions are used to control processes:
- Renicing: You can adjust the execution priority of a process by changing its Nice value: F7 decreases the Nice value, which increases the priority of the process. F8 increases the Nice value, which decreases the priority of the process and makes the process consume fewer resources.
- Killing a process (F9): To kill a process, select it and press F9 or k. A menu of signals that can be sent opens. There are two important signals here. SIGTERM (15) is the "polite" termination signal and gives the process time to perform cleanup operations. SIGKILL (9) is the "forced" termination signal that stops the process immediately. This signal is used for processes that do not respond to SIGTERM
Finally, one of htop's great features is tagging processes by pressing Space. This allows you to select multiple processes and perform batch actions, such as killing several processes at once.
Customizing htop
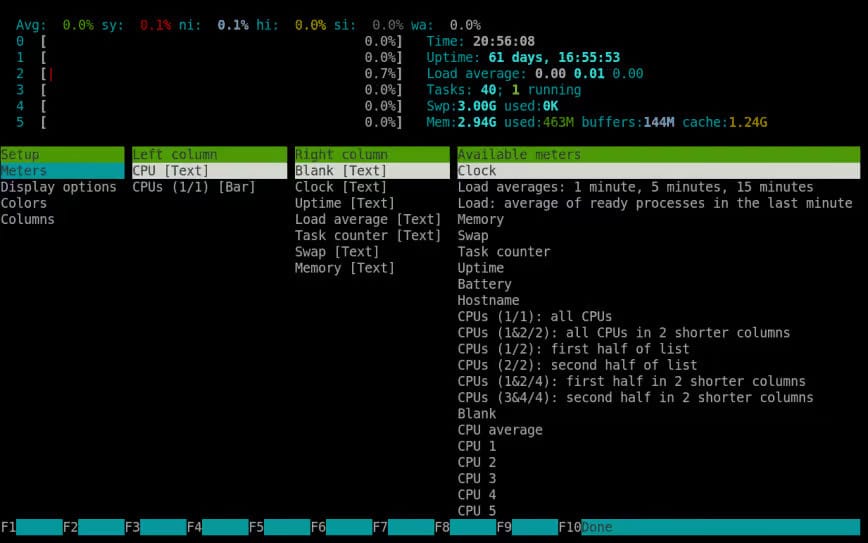
If you want to customize how htop is displayed based on your needs, you can press the F2 key to open the Setup menu. In this menu, you can add or remove different columns (such as adding the Load Average column or removing a specific one) and adjust the colors and display styles. After applying your changes, press F10 to save the configuration. Note that your settings are stored in a file located at ~/.config/htop/htoprc, and htop automatically rewrites this file.
Therefore, if you need the same configuration across multiple systems, you can simply copy this file between them.
Practical Use Cases of htop
htop is useful in many real-world scenarios, and some of the most common ones include:
- Real-time Server Monitoring: When you're working on a server (for example, a Linux VPS), htop is a great tool to quickly check CPU and memory usage, process count, and overall system load. It helps you see right away whether the server is under stress or if something unusual is happening.
- Identifying System Bottlenecks: As explained in the color-code section, htop lets you quickly determine whether your system is CPU-bound or I/O-bound. If the gray bar (I/O Wait) dominates the CPU meter, optimizing code won’t help. you need to inspect your storage or network layer. This makes troubleshooting much more focused and efficient.
- Tracking Resource Leaks and Rogue Processes: By sorting processes by memory (Shift+M), you can easily spot tasks that continuously consume too much RAM. This is a strong sign of memory leaks in applications. You can also use tools like stress to create artificial load and watch in htop how the system distributes work across CPU cores.
- Managing Complex Process Structures: The tree view (F5) is essential when dealing with parent applications (like database servers or web servers) that spawn many child processes. This view ensures you’re selecting and managing the correct parent process instead of just a single child task.
For an even deeper look at how your system memory is being used, don’t forget to Check Linux Memory Usage and get a clearer picture of your server’s performance.
Troubleshooting htop
Before we wrap up, it's useful to review a few common troubleshooting questions that users often encounter when working with htop.
- Why does htop show 100% CPU usage even though the system isn’t slow?
This usually means CPU-bound tasks are running, or short-lived processes are spiking temporarily. It may also refer to one core rather than total system usage. - Why are some processes not visible in htop?
A filter may be active (F3), or htop is currently showing processes from a specific user (U). Some processes also require root privileges to appear. - Why do htop colors or graphs display incorrectly in my terminal?
The color scheme in the F2 menu may be misconfigured, or your terminal might not support 256-color mode. - Why does htop forget my settings after reboot?
The htoprc file may not have been saved, or the user doesn’t have write permissions to ~/.config/htop/. Running htop as a different user can also cause this issue. - Why does htop automatically re-sort process lists?
Auto-sorting is enabled. You can disable it by pressing S to lock the current sorting order. - Why does htop show RAM usage differently from free -m or top?
htop calculates cache and buffers differently. The difference is normal and not a sign of incorrect memory reporting. - Why does a single process show more than 100% CPU usage?
Multithreaded applications can use several CPU cores. For example, 400% means the process is fully using four cores. - Why is htop slow on older or overloaded systems?
The refresh rate may be too high. In F2 → Setup → Display, increasing the update interval can reduce the load. - Why do I/O metrics in htop always show zero?
Your htop build may lack I/O accounting support, or the system’s libsystemd integration isn’t functioning correctly. - Why doesn’t killing a process in htop work?
The process may be in an uninterruptible sleep state (D state) or require a stronger signal such as SIGKILL (9).
For a more detailed view of all running processes and better process management, be sure to check out our Linux Process List guide.
Boost Your Server Efficiency with htop
We've now reached the end of the article, and as you’ve seen, htop is a powerful yet simple tool for monitoring and managing Linux processes. We recommend installing htop today and using it whenever you need quick and effective troubleshooting or system monitoring.
And if you don’t yet have a reliable Linux server to truly take advantage of htop’s full potential, consider checking out our Linux VPS services. They offer the speed, security, and flexibility you need to manage your Linux environments professionally and make your experience with htop and other monitoring tools even smoother.
People are also reading: