
You're paying for a VPS, something feels slow, and the support ticket you're about to write needs proof. A single browser speed test won't give you that proof. If you want to know how to test VPS network speed and bandwidth performance in a way you can actually trust, you need about three tools and a repeatable method. This guide walks you through both.
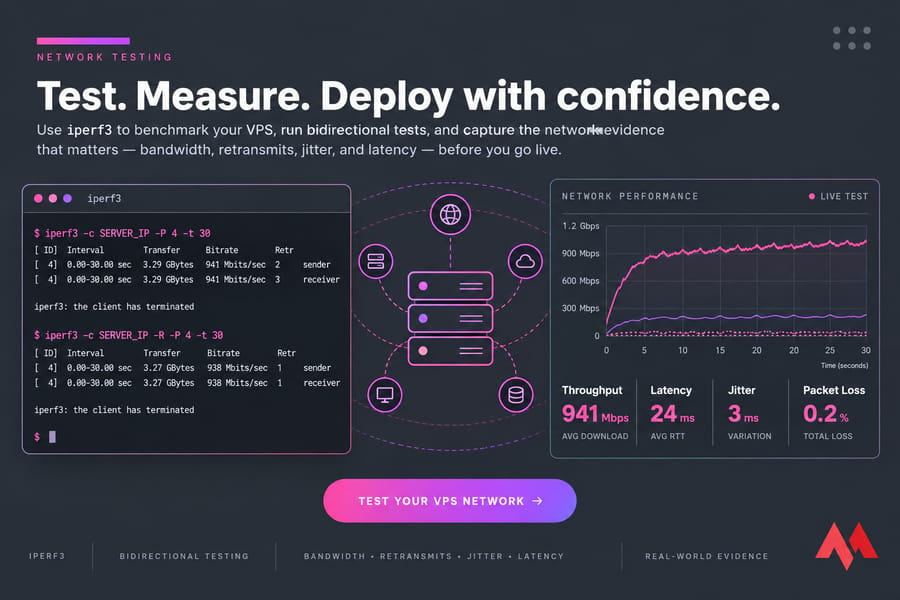
The short answer: use iperf3 to measure throughput, MTR or ping to check latency and packet loss, and Speedtest CLI only as a secondary check of the internet path. Test in both directions. Start with endpoints close to the server, repeat at different times of day, and write down bandwidth, retransmits, jitter, and latency together.
Before you start, you'll need:
- A running VPS you can reach over SSH or RDP (see how to connect to your VPS if you're new to this)
- sudo or administrator rights
- A second machine or a public iperf3 server to test against
- Port 5201 temporarily open if you'll run your own iperf3 server
- Low background CPU load, because a busy CPU will drag your results down
What a VPS Network Speed Test Actually Measures
"Speed" isn't a single number. People use the word for at least five different things, and each one affects a different kind of workload.
| Metric | What it means | Who feels it most |
|---|---|---|
| Bandwidth | The theoretical capacity of the port (e.g. 1 Gbps) | Everyone, as a ceiling |
| Throughput | The data rate you actually get end to end | Backups, file transfers, downloads |
| Latency (RTT) | The round-trip time for a packet | Trading bots, APIs, SSH sessions |
| Jitter | How much latency varies from one packet to the next | VoIP, game servers, streaming |
| Packet loss | The percentage of packets that never arrive | Everything. TCP slows down, UDP breaks up |
One more metric deserves attention: loaded latency. This is your ping while the link is busy. A server might show 20 ms at idle and then jump to 200 ms during a big transfer (that's bufferbloat), and for real-time apps that matters more than raw download speed. Cloudflare's speed test reports this split directly, listing packet loss, AIM scores (streaming/gaming/video chat ratings), and the latency-under-load (loaded vs unloaded latency).
That's why one test is never enough. A 900 Mbps result looks good, but it tells you nothing about the 3% packet loss on the route your customers in Singapore actually use. To go deeper on the latency side, read our guide on latency and how to reduce it, and our network optimization guide.
Best VPS Network Speed Test Tools for Accurate Results
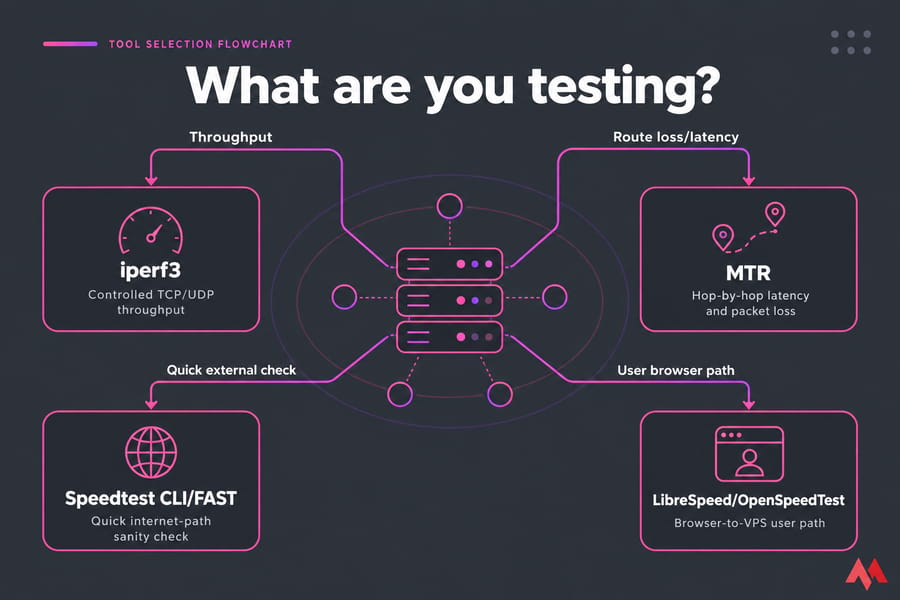
You've got about half a dozen options. Three of them matter for diagnosis, and the others are useful for checking what your users see.
| Tool | Best for | Limitation |
|---|---|---|
| iperf3 | Controlled TCP/UDP throughput between two endpoints you choose | Needs a server on the other end |
| MTR | Latency and loss across every hop on a route | Routers that rate-limit ICMP create false alarms |
| ping | A quick RTT baseline | No throughput data and no hop detail |
| Speedtest CLI | A quick internet-path sanity check | Third-party servers you can't control |
| LibreSpeed / OpenSpeedTest | Measuring the browser-to-VPS path your users take | Browser and client limits skew the numbers |
My take: iperf3 should be your first test almost every time. MTR comes next whenever something looks off. Speedtest is fine for a 30-second gut check, but it shouldn't be your evidence.
LibreSpeed is worth a look if you want to know what your visitors experience. It's a lightweight, open-source HTML5 speed test that measures download, upload, ping, and jitter directly in the browser, and you host it on your own VPS. OpenSpeedTest works the same way. For broader CPU and disk benchmarking, see our roundup of VPS benchmark tools. For ongoing observability, see VPS monitoring tools.
How to Test VPS Bandwidth with iperf3
iperf3 uses a client/server model. One machine listens and the other sends traffic to it. If you only have one VPS, test against a public iperf3 server, or better yet, a second small VPS in another region that you control.
Install iperf3
# Ubuntu / Debian
sudo apt update && sudo apt install -y iperf3

# CentOS / Rocky / AlmaLinux
sudo dnf install -y iperf3    # use yum on CentOS 7
If you need a refresher on the shell, our Linux commands cheat sheet covers the basics.
Run a basic TCP throughput test
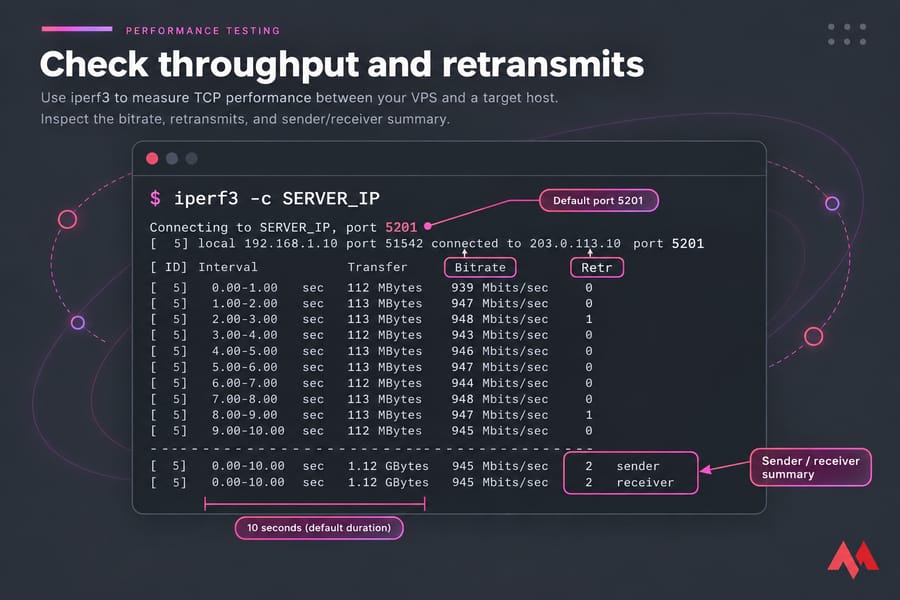
On the server side, start iperf3 in listen mode. It will listen to port 5201 by default. Use -p to pick a different port.
# On the server
iperf3 -s
# or on a custom port
iperf3 -s -p 5202

# On the client
iperf3 -c SERVER_IP
By default, the client uploads to the server for 10 seconds. Check the Bitrate column, and also check Retr (retransmits). A large retransmit count usually means packets are being lost somewhere on the path.
Test the other direction with reverse mode
Add -R and the server sends to the client instead. Upload and download often differ, sometimes by a lot, so you need to test both directions.
iperf3 -c SERVER_IP -RRun UDP tests for jitter and packet loss
TCP hides loss by retransmitting. UDP doesn't, which is exactly why it's useful here. Set a target bitrate with -b:
iperf3 -c SERVER_IP -u -b 200M -t 30The UDP summary reports jitter in milliseconds and lost/total datagrams. If you run a voice or game server, those two numbers matter more than the bitrate.
Use parallel streams and longer durations
A single TCP stream over a long-distance link often can't fill the pipe. Add parallel streams with -P and lengthen the test with -t:
iperf3 -c SERVER_IP -P 4 -t 30
iperf3 -c SERVER_IP -P 4 -t 30 -R
Run those as a pair. If single-stream results are poor and four streams come close to line rate, you're probably dealing with per-flow latency limits, not a broken network.
| Goal | Command | What it shows |
|---|---|---|
| Upload baseline | iperf3 -c IP |
Client → server throughput, retransmits |
| Download baseline | iperf3 -c IP -R |
Server → client throughput |
| Saturate the link | iperf3 -c IP -P 4 -t 30 |
Aggregate throughput over a stable window |
| Jitter/loss | iperf3 -c IP -u -b 100M |
Jitter in ms, lost datagrams % |
| Force IPv4/IPv6 | iperf3 -c IP -4 / -6 |
Protocol-specific path issues |
| Custom port | iperf3 -c IP -p 5202 |
Works around blocked or busy ports |
Choose endpoints wisely. Test against the nearest endpoint first so you get a clean baseline, then test one farther away. And only run tests against servers you're allowed to use. Hammering random hosts with UDP floods is a quick way to get your IP blocked. Testing 127.0.0.1 on the same VPS doesn't tell you anything about the public network, so skip it.
How to Run a VPS Latency Test with MTR and ping
Throughput is only half the picture. The other half is route stability.
Start with ping for a quick RTT baseline:
ping -c 50 TARGET_IPLook at min/avg/max and the mdev value at the end. A large mdev means jitter. Our ping command in Linux guide covers the flags, and there's a separate guide for pinging in CentOS.
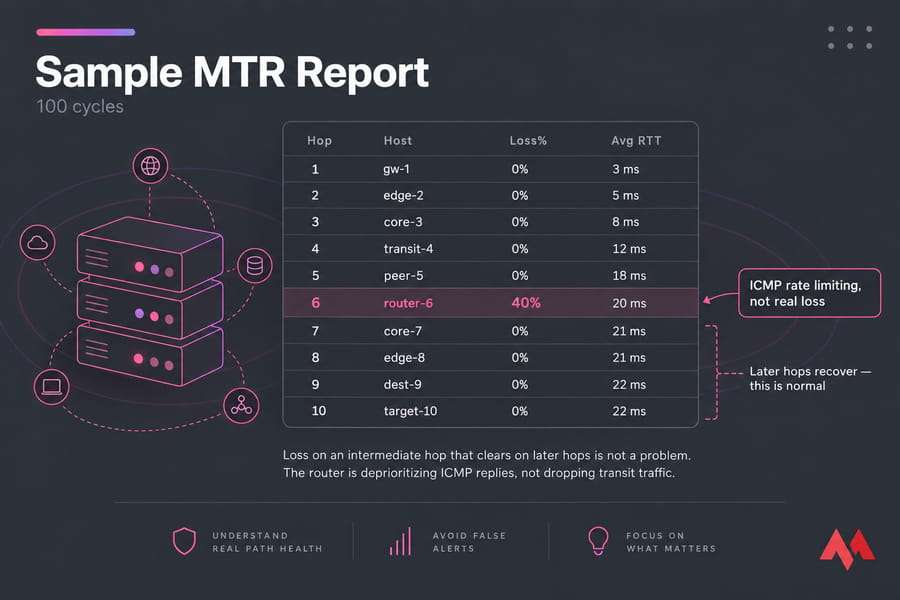
Next, run MTR. It combines ping and traceroute, and it calculates these ICMP replies and generates statistics, such as packet loss, round trip time (RTT), and jitter, for each hop.
sudo apt install mtr-tiny   # or: sudo dnf install mtr
mtr --report --report-cycles 100 TARGET_IP
mtr -4 --report -c 100 TARGET_IP   # IPv4 only
mtr -6 --report -c 100 TARGET_IP   # IPv6 only
sudo mtr -T -P 443 --report TARGET_IP   # TCP mode, bypasses ICMP filtering
Use 100 cycles. Without that option, the --report option will send 10 packets, which is too small a sample to trust.
How to read MTR without panicking
- Loss on one middle hop that clears on later hops isn't a problem. That router is just deprioritizing ICMP replies. In other words, ICMP limiting causes packet loss to one hop that does not persist to subsequent hops.
- Loss that starts at a hop and continues all the way to the destination is real, and that hop is your suspect.
- A sudden latency jump that stays high usually means a long physical link (an ocean crossing, for example) or a congested peering point.
- IPv4 looks clean but IPv6 doesn't (or the reverse)? The two protocols often take different routes, so test both.
How to Use Speedtest CLI on a VPS Without Misreading the Result
Speedtest CLI from Ookla is handy. Just don't treat it as your source of truth.
curl -s https://packagecloud.io/install/repositories/ookla/speedtest-cli/script.deb.sh | sudo bash
sudo apt install speedtest
speedtest -L          # list nearby servers
speedtest -s SERVER_ID
So why does Speedtest disagree with iperf3? In my experience it comes down to a few causes. Speedtest picks a third-party server whose load you can't see, the route is different, other people may be using that server at the same moment, and the client itself uses CPU. FAST.com reports both unloaded and loaded latency, which is nice, but it was built to estimate consumer internet speed. It wasn't built to certify a data center link.
| Speedtest CLI pros | Speedtest CLI cons |
|---|---|
| Installs and runs in under a minute | Its servers may be congested or underpowered |
| Thousands of endpoints worldwide | You can't control the far end |
| Reports ping and jitter alongside throughput | Results swing a lot between runs |
Browser tests run from your laptop have a bigger problem. They measure your home ISP and Wi-Fi, not the VPS. That's a different job, and it's closer to checking website speed. When Speedtest results look bad but iperf3 looks fine, the VPS backbone is probably fine too. Our article on why your VPS is slow covers the other likely causes.
How to Test Network Speed on Linux VPS and Windows VPS
| Step | Linux VPS | Windows VPS |
|---|---|---|
| Connect | SSH | RDP as administrator |
| Check CPU first | htop or top |
Task Manager → Performance |
| Install iperf3 | apt / dnf | Download the Windows binary zip and extract it to C:\iperf3 |
| Run a test | iperf3 -c IP -R |
.\iperf3.exe -c IP -R in PowerShell |
| Latency | mtr, ping |
ping -n 50, pathping, or WinMTR |
| Hosting the server side | Open 5201 in ufw/firewalld | Allow 5201 TCP/UDP in Windows Defender Firewall |
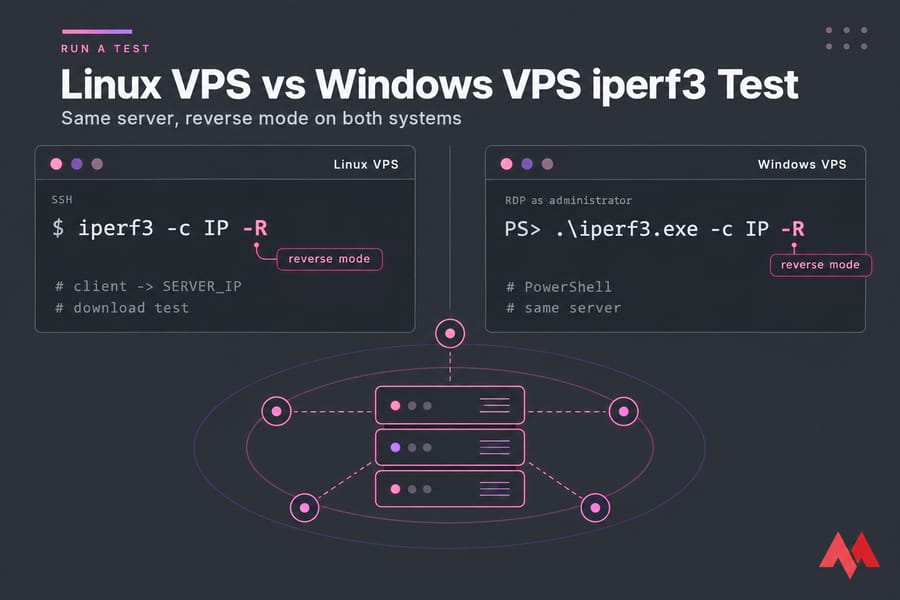
The CPU check isn't optional. If a backup job is maxing out a core, iperf3 shares that core with it and your bandwidth number drops. Then you end up blaming the network for a CPU problem. Learn how to check VPS resource usage before testing.
On Windows, ESnet doesn't publish official iperf3 builds, so you'll be using a community-maintained binary. Those builds work fine for testing. If you're running the server side, follow our steps to open a port in Windows Firewall. Close the port again when you're done. New to Windows servers? Start with how to set up a Windows VPS.
How to Interpret VPS Bandwidth Performance Results
There's no universal "good" Mbps figure. What's good depends on the plan's port speed, the distance, the peering between networks, the protocol, and your workload. On a 1 Gbps port, 850–940 Mbps to a nearby endpoint is healthy. Getting 300 Mbps across the Pacific on a single stream can be completely normal too.
| If you see | Suspect | Next test |
|---|---|---|
| High TCP retransmits | Packet loss or congestion on the path | MTR to the same target |
| Fast nearby, slow far away | Distance or peering | Run with -P 4, then try a closer location |
| Upload fine, download poor | Asymmetric route or remote-side limits | -R against a different endpoint |
| Slow only at peak hours | Congestion upstream | Repeat tests off-peak and log timestamps |
| Low result with a CPU core at 100% | CPU bottleneck | Stop background jobs and re-test |
| UDP jitter above roughly 30 ms | Unstable route or bufferbloat | Check loaded latency and run MTR |
| Speedtest slow, iperf3 fine | The third-party test server | Ignore it or pick another Speedtest server |
| Network fine, app still slow | The application or database layer | Profile the app instead |
Build a baseline: the nearest endpoint, a second region, reverse mode, plus one off-peak run and one peak-hour run. That's eight data points, and it's far more convincing than one screenshot. To keep tracking these numbers over time, see VM monitoring metrics. If the server side turns out to be the bottleneck, see how to improve VPS performance.
Common VPS Speed Test Mistakes to Avoid
- Testing only once. Routes and load change from hour to hour, and one sample can easily be an outlier.
- Testing to a single distant endpoint. That measures the distance as much as the server.
- Relying only on browser or Speedtest results. Those measure someone else's infrastructure as much as yours.
- Testing during backups or updates. CPU and disk contention cap your numbers.
- Running loopback tests. Testing localhost says nothing about the public network.
- Ignoring loaded latency and jitter. A link can deliver 900 Mbps and still be unusable for VoIP.
- Treating app slowness as network slowness. Slow PHP or a missing database index can look like "slow internet." Our guide on troubleshooting a Linux VPS helps separate the two, and so do good habits for how you manage a VPS server.
One quick extra check: if a site "loads slowly" only on first visit, run the nslookup command. Slow DNS resolution sometimes gets mistaken for a bandwidth problem.
What to Do If Your VPS Network Is Slow
Don't blame the provider automatically. Check these first:
- Re-test against one nearby endpoint and one distant endpoint.
- Run reverse mode and UDP mode, not just the default upload test.
- Run MTR (100 cycles) to the destination that's actually affected.
- Check CPU usage, running cron jobs, and any firewall or QoS rules.
If the network is fine but your users are far away, the fix isn't more tests. It's moving the server closer. MonoVM has VPS locations in 25+ regions, which makes A/B testing simple: spin up a second instance, for example a USA VPS server for North American traffic, and compare the iperf3 and MTR results. If you move a lot of data, an unlimited bandwidth VPS removes the worry about transfer caps.
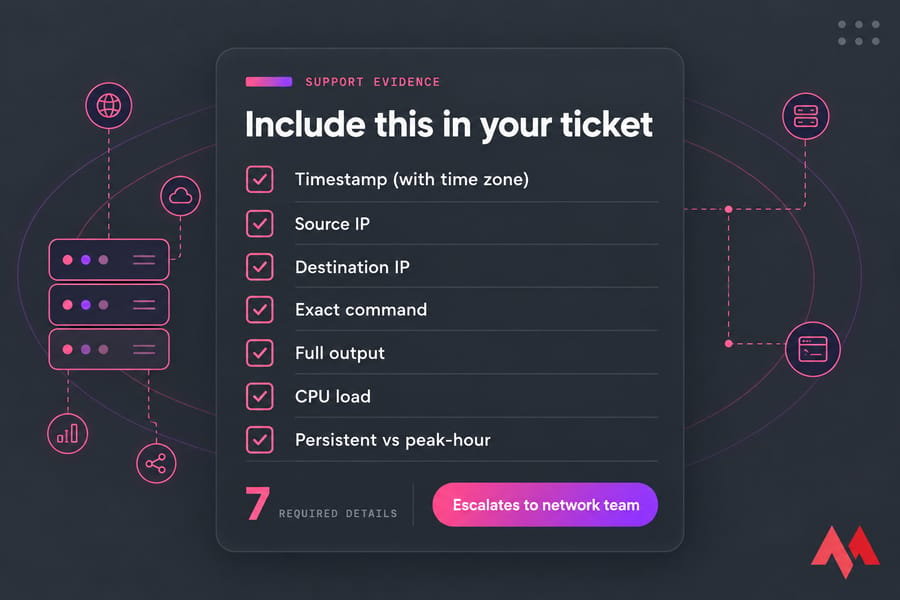
If you're opening a ticket with MonoVM support, include:
- Timestamps with time zone
- Source and destination IPs
- The exact commands you ran
- The full output, not a cropped screenshot
- CPU load at the time of the test
- Whether the problem is constant or only at peak hours
A ticket with this information gets escalated to the network team. A ticket that just says "it's slow" usually gets a reply asking for this information.
Need lower latency from the start? If your tests show the route to your audience is simply too long, compare MonoVM VPS locations and deploy closer to your users.
Testing VPS network speed and bandwidth properly comes down to a few habits: measure throughput with iperf3, check the route with MTR, keep Speedtest in its place as a quick check, and record everything. Once you've got trustworthy numbers, pick the server that fits your workload, whether that's a Linux VPS hosting plan or a Windows VPS hosting plan, in the region closest to your users.

An experienced tech and developer blog writer, specializing in VPS hosting and server technologies. Fueled by a passion for innovation, I break down complex technical concepts into digestible content, simplifying tech for everyone.