![How to Optimize a Database on a VPS [2026] ⚡](/wp-content/uploads/2026/09/database-optimization-on-vps163-main.webp)
Short answer up front: database optimization on VPS means tuning queries, indexes, memory, caching, and disk I/O to fit the resources your virtual server actually has. Diagnose the bottleneck first, then fix the database engine, the Linux layer, and storage — upgrading the plan comes last.
I've lost count of how many times someone pasted a "best my.cnf" from a forum into a 2 GB VPS and wondered why MySQL started crashing. Copying configs isn't tuning. Let's do this properly.
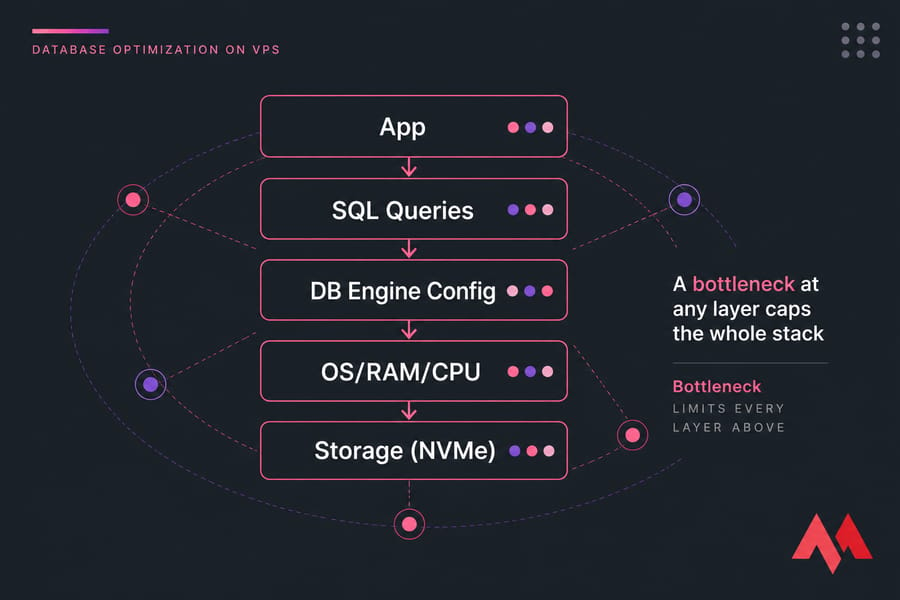
What database optimization on a VPS actually means
On a Linux VPS you control four layers, and any one of them can be your ceiling:
- Queries and schema — missing indexes,
SELECT *, bad joins, ORM-generated junk. - Engine config — MySQL/MariaDB buffer pool, PostgreSQL shared buffers, connection limits.
- OS resources — RAM, CPU, swap behaviour.
- Storage — IOPS and latency, which is where most VPS databases actually die.
Unlike shared hosting, nothing here is hidden from you. But you also share physical hardware with other tenants, so CPU steal and noisy neighbours are real. There's no universal config — only workload-appropriate ones.
Diagnose the bottleneck before you touch anything
Back up first. Snapshot the VPS or at least back up a database from phpMyAdmin. Then measure during normal load and peak load — a baseline taken at 3 a.m. tells you nothing.
htop                 # CPU saturation, load average, per-core usage
free -m              # RAM headroom and swap usage
vmstat 1 10          # si/so columns = swapping; wa = I/O wait
iostat -xz 1 5       # %util and await per device
df -h # full disks break databases quietly| Symptom | Likely cause | First check | First fix |
|---|---|---|---|
| High load, low disk activity | CPU-bound queries | htop, slow query log |
Index the top offenders |
| Constant swapping | Over-allocated cache | free -m, vmstat |
Lower buffer pool / shared_buffers |
High %iowait |
Slow storage or too many writes | iostat -xz |
Reduce I/O, move to NVMe |
| "Too many connections" | No pooling in the app | DB process list | Add a connection pooler |
| Random stalls, low own usage | CPU steal time | st column in top |
Talk to your provider / migrate |
Linux metrics only tell half the story, so pull database-side stats too — enable the slow query log on MySQL, and pg_stat_statements on PostgreSQL. For the OS side, our guides on how to check Linux CPU usage and check Linux memory usage go deeper, and VM monitoring metrics covers what to graph long-term.
VPS resource optimization for database workloads
Databases care about memory and storage latency far more than raw core count. If your working set fits in RAM, reads mostly stop hitting disk. If it doesn't, every query is a disk query.
| Storage | Typical latency | Best for | Limitation |
|---|---|---|---|
| HDD | 5–15 ms | Archives, cold backups | Unusable for busy OLTP |
| SATA SSD | ~0.3–1 ms | Small to mid databases | IOPS ceiling under write load |
| NVMe | ~0.05–0.2 ms | Write-heavy, high-concurrency DBs | Costs more per GB |
Also: keep backups, logs and temp files off the same volume if you can, and don't co-host a dozen apps next to your production database. See improve VPS performance and optimize Linux performance for the OS-level work.
Quick summary: on small VPS plans, RAM and disk I/O are almost always the first two constraints. CPU is third.
MySQL and MariaDB tuning on a VPS
Change one setting, restart, measure, repeat. Restarting flushes caches, so expect a few minutes of "worse" before it settles.
| Setting | What it does | Risk if set too high |
|---|---|---|
innodb_buffer_pool_size |
Caches data + indexes in RAM | Swap storms, OOM kills |
innodb_log_file_size |
Write throughput smoothing | Longer crash recovery |
max_connections |
Concurrent client limit | Each connection eats RAM |
tmp_table_size / max_heap_table_size |
Keeps temp tables in memory | Memory spikes per query |
table_open_cache, thread_cache_size |
Reduces repeated open/close overhead | Minor memory waste |
Rough starting points: on a 2 GB VPS running WooCommerce, a buffer pool around 512 MB with max_connections capped near 50 usually beats anything more aggressive. On 8 GB dedicated to MySQL, 4–5 GB buffer pool is reasonable. Verify against your actual data size:
SELECT table_schema, ROUND(SUM(data_length+index_length)/1024/1024) AS mb
FROM information_schema.tables GROUP BY table_schema;
New to the stack? Start with install MySQL on Ubuntu. mysqltuner is handy for a second opinion — treat its output as suggestions, not orders.
PostgreSQL tuning on a VPS
shared_buffers around 25% of RAM is the usual starting point, but on a 1–2 GB VPS that guidance falls apart — leave more room for the OS page cache. Set effective_cache_size to roughly 50–70% of RAM; it's a planner hint, not an allocation.
work_mem is the dangerous one. It's allocated per sort or hash operation, so 64 MB × 40 connections × two sorts each will happily eat your server. Keep it small globally and raise it per-session for heavy reports.
CREATE EXTENSION IF NOT EXISTS pg_stat_statements;
SELECT query, calls, mean_exec_time
FROM pg_stat_statements ORDER BY mean_exec_time DESC LIMIT 10;
Don't disable autovacuum. Bloated tables on a small VPS are a slow-motion outage. Run VACUUM ANALYZE after big deletes and keep statistics fresh. Setup guide: install PostgreSQL on Ubuntu.
Query optimization and indexing
Honestly? One index on a high-frequency query beats a week of config tweaking. Run EXPLAIN (or EXPLAIN ANALYZE in PostgreSQL) on your slowest statements and look for sequential scans on large tables.
| Bad pattern | Why it hurts on a VPS | Better approach |
|---|---|---|
SELECT * |
Wastes RAM and network on unused columns | Select only what you need |
| Unindexed WHERE/JOIN columns | Full scans burn CPU and I/O | Index the filtered columns |
| Index on everything | Slows writes, inflates disk use | Drop unused indexes |
| Large sorts without index support | Spills to disk temp files | Index the ORDER BY, or pre-aggregate |
Schema matters too — poor structure multiplies row reads. Database normalization explains the trade-offs.
Caching, pooling, and replication
Caching won't rescue a bad query, but it stops repeat work. Redis or Memcached in front of expensive read paths cuts database calls hard — see Memcached vs Redis. Connection pooling (PgBouncer, ProxySQL, or your framework's pool) fixes the "too many connections" spiral without raising limits. And when reads are the problem and one server can't keep up, database replication with a read replica beats endless vertical scaling.
Common mistakes I see constantly
- Changing six settings at once, so you can't tell which one helped.
- No snapshot beforehand — always back up a server or VPS first.
- Over-allocating memory until the kernel starts swapping.
- Restarting production at peak instead of in a maintenance window.
- Tuning the database when the real problem is a PHP loop firing 400 queries per page.
When to upgrade instead of tune
| Scenario | Action |
|---|---|
| Slow queries, RAM to spare | Optimize — don't spend money yet |
| Working set larger than RAM, constant swap | Upgrade RAM |
High %iowait on SSD, write-heavy app |
Move to NVMe |
| Sustained CPU saturation after query fixes | Add vCPU or scale out |
| Compliance, isolation, or huge steady load | Dedicated server |
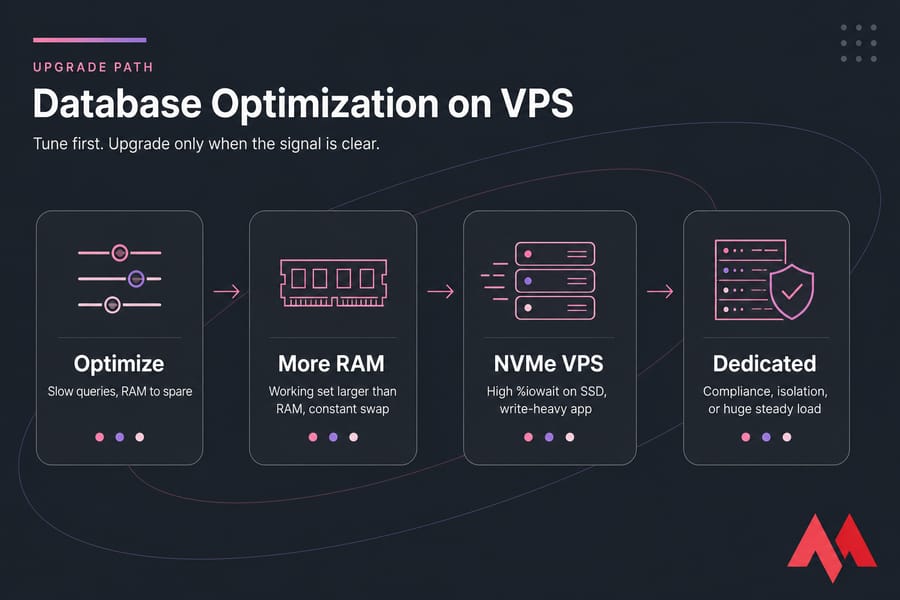
If storage latency is your ceiling, NVMe VPS hosting makes every other optimization work harder. For pre-tuned database stacks, MySQL VPS hosting is the shortcut, and Cloud VPS handles workloads that need elastic headroom. Root access, 25+ locations, 24/7 support.
Explore MonoVM NVMe VPS plans and give your database the I/O it's been begging for.

An experienced tech and developer blog writer, specializing in VPS hosting and server technologies. Fueled by a passion for innovation, I break down complex technical concepts into digestible content, simplifying tech for everyone.