Technical analysis helps the investor foresee how the markets will move based on past price data, volume, and chart patterns. Unlike fundamental analysis, which looks at financials or macroeconomic indicators, technical analysis focuses on the price action and sentiment in the market.
Thus, the strength lies in the tools used; it could be charting software, an indicator, or an automated trading platform. In an ocean of many technical analysis tools, choosing the correct one would amplify the trader's accuracy, timing, and ultimately, profit. This article lists the most reliable and best tools of 2025, matching all trading styles and experience levels.
What Makes a Great Technical Analysis Tool?
The best tools for technical analysis must provide solid charting and an interface that is quick and flexible for traders to base decisions upon. One should be able to change views and time frames with candlestick, bar, or line charts to visualize trends, reversals, and support/resistance zones. In addition, most of the advanced charting platforms will have drawing tools for trendlines and Fibonacci retracements, as well as checking places for traders to make visual analyses to feel 100% confident in their strategy.
Secondly, the presence of several built-in indicators or overlays is essential. The best tool supports all famous indicators such as Moving Averages, MACD, RSI, Bollinger Bands, and Ichimoku Clouds, so that a trader can analyze momentum, volatility, and likely entry and exit points. Above all these, users should be able to create or import custom indicators to customize their analyses and follow elaborate strategies appropriate for a particular trading style or asset class.
Customization and automation features improve the value of a technical analysis platform. Such tools testing hypotheses, automating trades, and avoiding emotional decisions, using scripting language support like Pine Script or strategy backtesting engines; integration with a broker then assures swift execution and removes any friction that might come from the analysis step.
Finally, there should be smooth user interaction with good UI design throughout desktop, web, and mobile platforms, where ease of access with a good design will decide whether one acts on insight at the right time or misses out altogether.
Related Article: Best Trading Platforms of 2025
Best Technical Analysis Tools in 2025
Since the markets are full of platforms, the choice of technical analysis tool depends on the experience level, trading instruments the trader intends to trade, and features needed by him or her. Since 2025, some technical analysis software has distinguished itself because of strong charting systems with plenty of indicators, customization features, and Broker Integration.
TradingView
TradingView remains one of the most popular charting platforms, thanks to its intuitive interface and powerful scripting capabilities via Pine Script. It’s widely used by traders of all levels, especially those focused on stocks, crypto, and forex.
- Strengths:
- Cloud-based and accessible across all devices
- Pine Script support for custom strategies and indicators
- Strong social features for community insights and shared ideas
- Weaknesses:
- Limited backtesting and alerts in free accounts
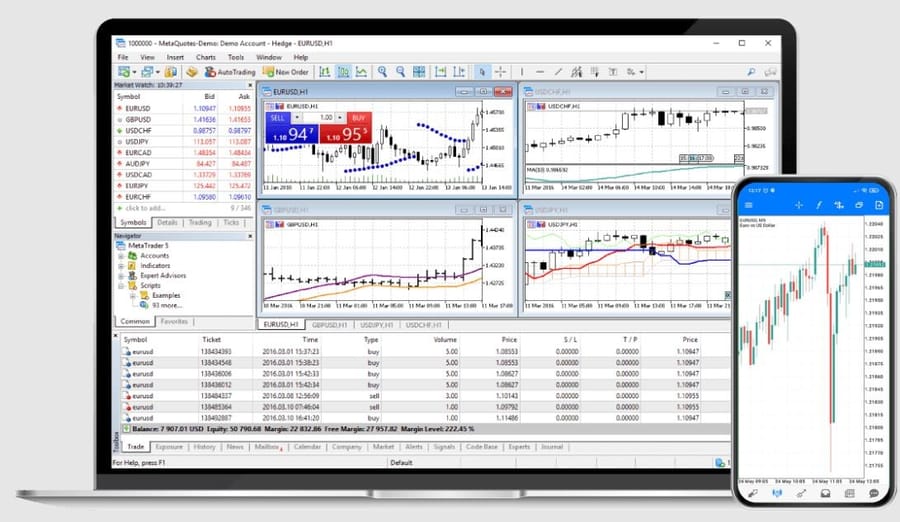
MetaTrader 4/5
MetaTrader 4 and 5 are industry standards in forex and CFD trading. Their powerful automation and custom indicator capabilities make them ideal for algorithmic traders.
- Strengths:
- Extensive support for algorithmic trading via Expert Advisors
- Vast library of custom indicators and community plugins
- Weaknesses:
- Dated user interface and design
- Steep learning curve for new users
Related Article: MetaTrader Optimization Guide for Forex VPS
ProRealTime
ProRealTime offers advanced charting and backtesting features with real-time data, catering to professional traders and quants looking for precision tools.

- Strengths:
- High-quality automation and strategy development tools
- Real-time market data and detailed technical capabilities
- Weaknesses:
- Not beginner-friendly; better suited for experienced users
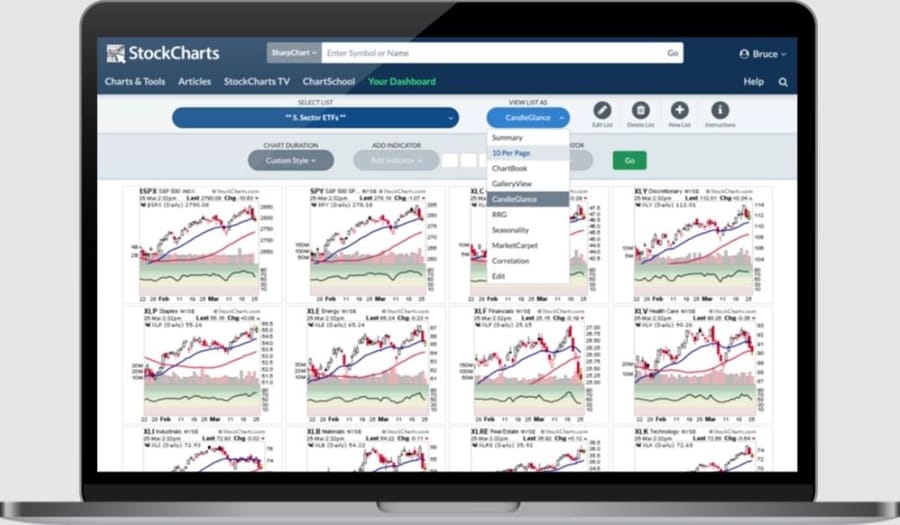
StockCharts.com
Ideal for educational use and casual traders, StockCharts.com provides pre-built strategies, a clean interface, and valuable learning materials.
- Strengths:
- Built-in strategies and educational content for self-learners
- Easy-to-use for beginners
- Weaknesses:
- Limited in real-time data and chart customization compared to competitors
Thinkorswim by TD Ameritrade
Thinkorswim delivers a professional-grade trading experience with comprehensive tools and paper trading features, making it a top pick for serious equity traders.
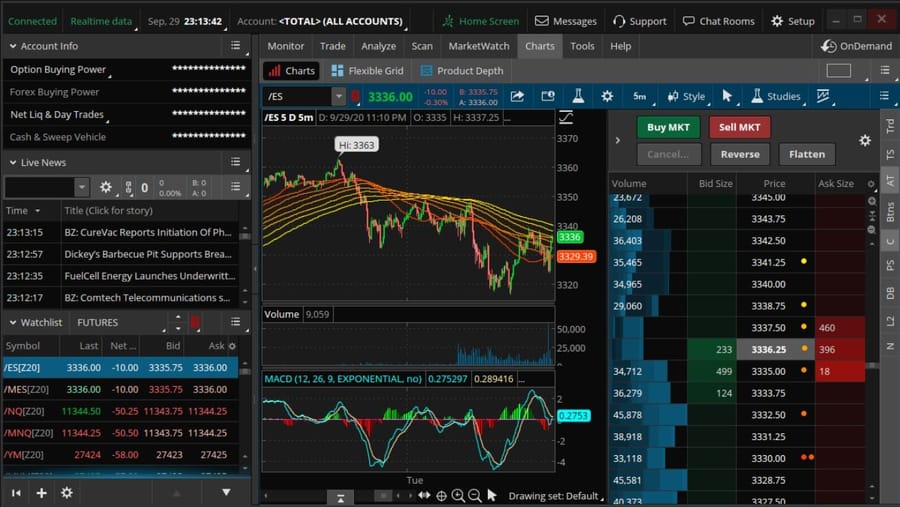
- Strengths:
- Advanced trading features and real-time data
- Excellent paper trading and simulation environment
- Weaknesses:
- Available only to U.S. residents
- Requires strong hardware for optimal performance
NinjaTrader
NinjaTrader is a favorite among futures and options traders, offering deep customization, automation, and a robust marketplace for third-party tools.
- Strengths:
- Fully customizable platform with algorithmic trading support
- Excellent for futures and options analysis
- Weaknesses:
- Advanced features are locked behind paid plans
- The interface may be overwhelming for casual traders
Strike.money (for beginners)
Strike.money is designed with new traders in mind, providing simplified tools, clear insights, and basic education for getting started with technical analysis.
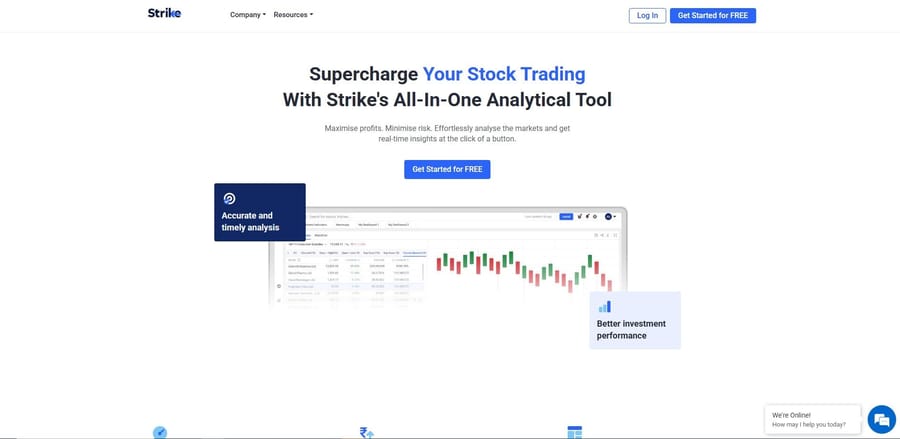
- Strengths:
- Beginner-friendly design and simplified charting
- Useful educational content for novice traders
- Weaknesses:
- Lacks advanced tools and customization options
- Limited support for multiple asset classes
Comparison Table: Technical Analysis Tools
With many platforms, a trader has difficulty deciding which specific technical analysis tool would fit their particular needs. For one, the process is simplified by the following table, which compares the top tools of 2025, considering many vital factors such as charting capabilities, supported indicators, scripting and automation, broker integration, ease of use, and user profile.
|
Tool |
Charting Capabilities |
Indicators Support |
Scripting & Automation |
Broker Integration |
Ease of Use |
Best For |
|
TradingView |
Excellent |
Extensive |
Pine Script (Custom) |
Limited (via APIs) |
Very user-friendly |
All traders, social traders |
|
MetaTrader 4/5 |
Strong (especially for Forex) |
Extensive |
Expert Advisors (EAs) |
Strong (many brokers) |
Moderate (steep learning) |
Forex, algorithmic traders |
|
ProRealTime |
Advanced |
High |
Advanced automation |
Good (select brokers) |
Complex interface |
Professionals, quant traders |
|
StockCharts.com |
Basic to Moderate |
Moderate |
Limited customization |
None |
Easy to use |
Beginners, educators |
|
Thinkorswim |
Advanced |
High |
ThinkScript |
Native (TD Ameritrade) |
Moderate to hard |
U.S. traders, equity analysts |
|
NinjaTrader |
Professional-grade |
High |
Full automation support |
Direct integration |
Complex interface |
Futures/options traders |
|
Strike.money |
Basic |
Basic |
Not supported |
None |
Very easy |
Beginners, casual traders |
Technical Analysis Tools by Use Case
The choice of technical analysis method is made based on your trading goals, your experience with trading, and your preferred classes of assets. For a beginner trader barely beginning to connect, StockCharts and Strike.money would provide an interface that is simple to use, complete with educational resources and graphical visualizations, easy to interpret.
These instruments minimize complexity and are therefore suited for users who are still grasping some very basic concepts regarding price action, indicators, and trend analysis, while getting confused with all the advanced talk.
For specialized needs, one needs market-defined platforms. MetaTrader 4/5 and TradingView are better suited for Forex as they provide superior precision, integration with brokers, and real-time execution. Platform-wise, algorithmic traders prefer ProRealTime and NinjaTrader because of scripting, backtesting, and other advanced automation tools that support their reliance on the functioning and running of trading bots.
TradingView and Thinkorswim will support the other half of active traders, with real-time alerts, full chart access, and effortless device syncing. The said features will grant an active trader any degree of freedom or speed he or she may want.
Top Indicators to Use with Technical Analysis Tools
Technical indicators are essential to any effective trading strategy, offering insights into market trends, momentum, and potential reversal points. Whether you're analyzing stocks, forex, or cryptocurrencies, these indicators help make data-driven decisions and reduce emotional biases. Below are the five most widely used indicators that integrate seamlessly with nearly all modern technical analysis tools.
Moving Averages
Moving Averages smooth out price data to identify the overall direction of a trend. The most common types are the Simple Moving Average (SMA) and the Exponential Moving Average (EMA), each with its own level of sensitivity to price changes. They are frequently used for determining support and resistance levels or generating buy/sell signals when shorter-term averages cross longer-term ones (e.g., 50-day and 200-day). Moving averages are most effective in trending markets and less so during sideways movement.
MACD (Moving Average Convergence Divergence)
MACD is a momentum and trend-following indicator that shows the relationship between two EMAs—usually the 12-day and 26-day. It consists of the MACD line, signal line, and histogram, providing clear signals for potential entries and exits. Traders often look for crossovers between the MACD and signal line, or divergences between MACD movement and price action. This indicator works well for spotting momentum shifts and confirming trend strength.
RSI (Relative Strength Index)
RSI measures the speed and change of price movements to identify overbought or oversold conditions. It ranges from 0 to 100, with values above 70 suggesting overbought conditions and below 30 indicating oversold levels. RSI is especially useful for timing entries during pullbacks or identifying potential trend reversals. It’s most effective when used in conjunction with trend indicators like moving averages or support/resistance analysis.
Bollinger Bands
Bollinger Bands consist of a moving average (typically 20-period) and two standard deviation bands above and below. They help traders identify volatility and potential breakout opportunities. When price touches the upper or lower band, it may signal an overextended move or potential reversal, especially in range-bound markets. Bollinger Bands are excellent for recognizing "squeeze" setups—periods of low volatility often preceding sharp price movements.
Fibonacci Retracement
Fibonacci Retracement is a popular tool for identifying potential support and resistance levels based on key ratios (23.6%, 38.2%, 50%, 61.8%, and 78.6%). It’s used by drawing a line between a high and a low point, then projecting horizontal lines at these ratios. Traders often watch for price reactions around these levels to plan entries or exits during corrections in trending markets. When combined with other indicators, Fibonacci levels offer strong confluence for decision-making.
How to Choose the Right Tool
Selecting the right technical analysis tool depends on your trading experience, the markets you trade, and the features you prioritize. Beginners may benefit from platforms with user-friendly interfaces and educational content, while advanced traders often need robust automation, custom scripting, and fast execution. Your trading asset—be it stocks, forex, crypto, or futures—also plays a key role, as not all platforms support every market equally. Additionally, consider your budget and whether real-time data or premium features are necessary for your strategy.
- Experience Level:
- Beginners should look for simple interfaces, guided tutorials, and built-in indicators (e.g., StockCharts, Strike.money).
- Advanced users may need scripting languages, algorithmic tools, and detailed analytics (e.g., ProRealTime, NinjaTrader).
- Asset Class:
- Forex and CFD traders typically prefer MetaTrader 4/5 for its broker integrations and real-time execution.
- Stock and crypto traders often go for TradingView or Thinkorswim for wider asset coverage and visualization.
- Desired Features:
- If you need alerts, strategy backtesting, or automated trading, prioritize platforms that support these natively or via plugins.
- Consider whether mobile compatibility, community support, or broker syncing is essential for your workflow.
- Pricing and Data Feeds:
- Free tools like TradingView (basic plan) are good starting points, but may lack real-time data or full feature access.
- Premium platforms offer greater accuracy and flexibility, but come with monthly or annual fees—check what’s included.
Conclusions
The Trading indicators and platforms today are quite dynamic, and having the right technical analysis tools might be the fine edge that makes a difference in your decision-making and profitability. A 2025 trading platform could virtually be anything: from simple, straightforward platforms such as StockCharts or Strike.money to extremely advanced solutions such as ProRealTime and NinjaTrader.
Despite what one fancies in a technical platform, charting, automation, mobility, or indicator variety, one seems to fit their exact feature needs. And a final caution: do not get committed to just one. Instead, use their demo accounts or free licenses to test as many platforms as possible to choose the most aligned with your strategy.