The Fair Value Gap (FVG) has become a buzzword in trading communities, especially among those who follow smart money concepts inspired by ICT (Inner Circle Trader). But what exactly is an FVG? How can understanding and trading it help you in forex, crypto, or other markets? In this guide, we’ll break down the theory, show you how to identify FVGs on charts, and teach you practical strategies for using them to make smarter trading decisions in 2025.
Understanding Fair Value Gaps
Definition & Origin (ICT / Smart Money Concept)
A Fair Value Gap is a price imbalance on the chart caused by aggressive institutional buying or selling. The term was popularized by Michael J. Huddleston, known as ICT, who explained how large players (smart money) create these gaps during rapid price movements.
Technically, an FVG appears as a gap between the wicks or bodies of candles, typically identified over a 3-candle pattern. This gap represents an area where price did not spend much time, reflecting a temporary imbalance between buyers and sellers.
Because institutions often “run through” liquidity zones quickly, they leave these gaps behind. Later, price tends to return to these areas to “fill” the gap, capturing remaining orders and providing traders with high-probability setups.
Market Contexts Where FVG Appears
Fair Value Gap Trading can appear in any liquid market—forex, crypto, indices, and commodities—but are especially visible in fast-moving markets with strong institutional participation.
- During strong trending moves, aggressive market makers create FVGs.
- During reversals or corrections, price may revisit FVG zones as part of normal market retracement.
- On higher timeframes (H4, D1), FVGs tend to be more reliable, though less frequent.
- On lower timeframes (M15, H1), FVGs appear more often but can be noisy and require stronger confirmation.
How to Identify a Fair Value Gap on a Chart
Identifying a Fair Value Gap (FVG) on your trading charts is a fundamental skill if you want to incorporate smart money concepts into your trading approach. The easiest and most common method to identify an FVG is by examining a specific 3-candle pattern, which reveals where price has “skipped” certain value areas, leaving behind a gap that market participants often revisit.
3-Candle Pattern Explained
Let’s break down this pattern step by step:
- Candle 1: This candle typically initiates a strong directional move. It could be a large bullish candle pushing price aggressively upwards or a bearish candle driving price sharply down. This candle reflects the beginning of institutional involvement, where big players execute sizable orders that move the market decisively.
- Candle 2: Following this initial surge, Candle 2 continues the momentum in the same direction. This candle often “gaps” away from Candle 1’s range, meaning the price opens above the high of Candle 1 in a bullish scenario (or below the low in a bearish scenario). The gap represents a price range where trading volume was minimal or absent, as the market quickly moved through that zone. It’s this lack of traded volume or liquidity that creates the FVG.
- Candle 3: The third candle confirms this imbalance by pushing price further in the same direction, maintaining or widening the gap created between Candle 1 and Candle 2. This reinforces that the market didn’t spend meaningful time at the prices within the gap.

The Fair Value Gap Trading itself is the price range that is “missing” or not fully covered by Candle 2 in relation to Candles 1 and 3. For a bullish FVG, this gap is identified between the high of Candle 1 and the low of Candle 3 — meaning price jumped over that area without meaningful trading.
Bullish vs Bearish Fair Value Gaps
It’s essential to distinguish between bullish and bearish FVGs as they imply different market dynamics and trading opportunities.
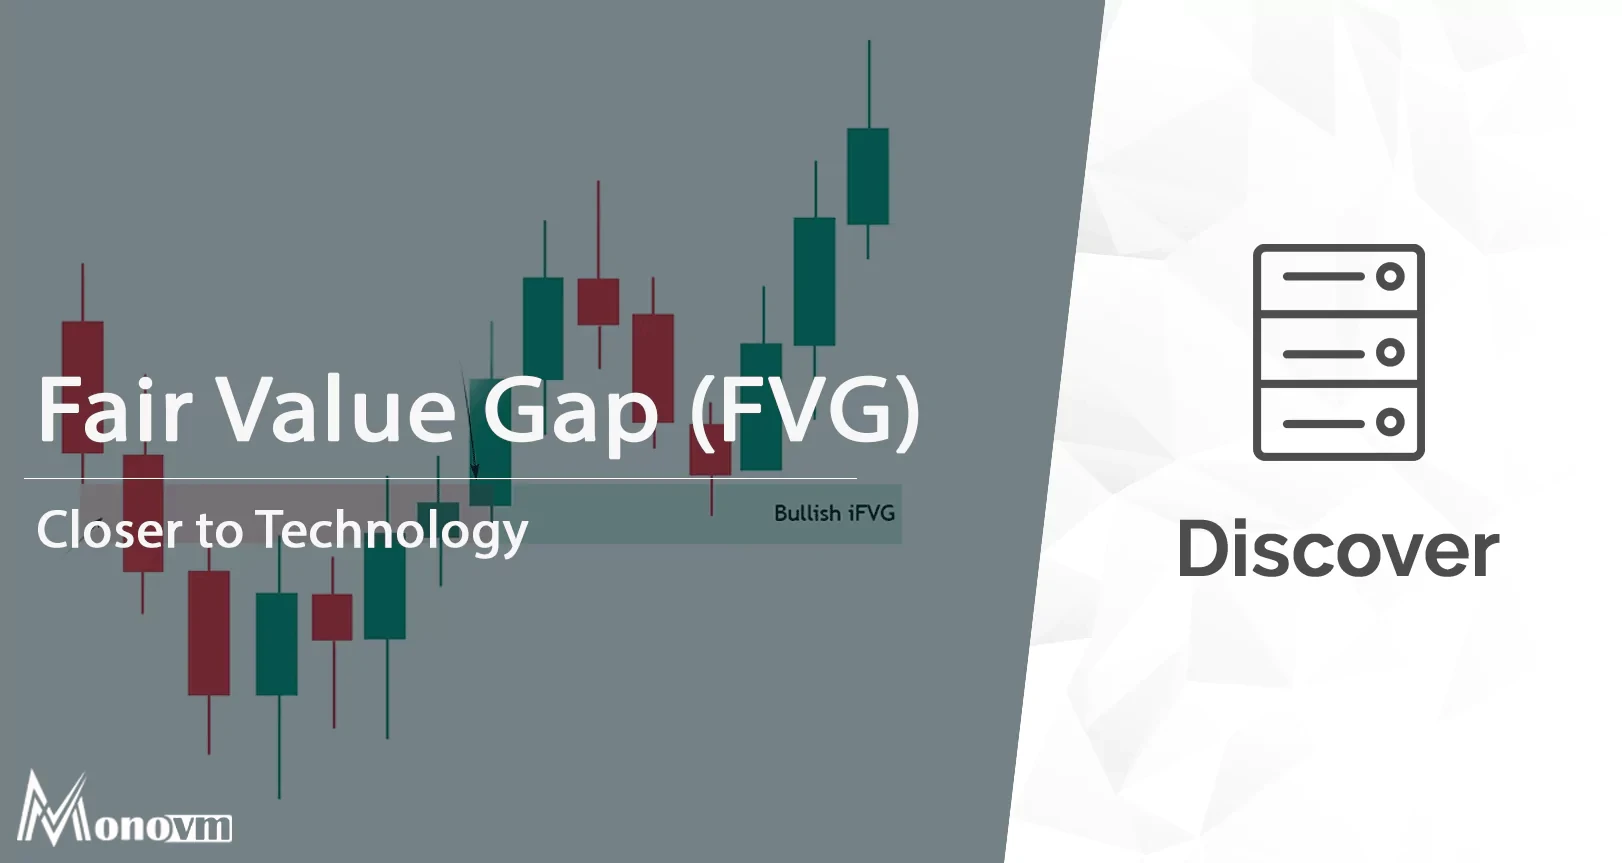
- Bullish Fair Value Gap Trading: This gap emerges during a swift upward move when price leaps higher, skipping over a certain range of value on the downside. Visually, you will notice a space or gap below these candles where the sellers were unable to place enough orders to stop or slow the buying pressure. Essentially, the sellers “gave up” that zone, and smart money quickly pushed through it.

- Bearish Fair Value Gap Trading: In contrast, a bearish FVG happens during a rapid downward move when price drops suddenly, skipping over a zone of value on the upside. This gap appears above the candle bodies or wicks, indicating where buyers were overwhelmed and couldn’t defend the price level.

Using Fair Value Gaps in Your Trading FVG Strategy
Fair Value Gaps offer an exciting way to incorporate institutional order flow dynamics into your trading, but using them effectively requires a disciplined approach combined with confirmation tools. Let’s explore a step-by-step trading method incorporating FVGs.
Entry, Stop-Loss & Take-Profit Logic
1. Mark the Fair Value Gap Trading Zone:
Begin by drawing a rectangle around the gap area between Candle 1 and Candle 3 where the imbalance occurred. This rectangle visually highlights the price range that the market skipped. Many charting platforms allow easy drawing of such zones.
2. Wait for Price to Return:
The key trading premise with FVGs is that price will often retrace to “fill” this gap. Instead of entering immediately after the gap forms, patient traders wait for price to come back into the zone. This is where entries become more favorable, as the market tests the unfilled liquidity left behind by institutional moves.
3. Look for Confirmation Signals:
Simply entering on the FVG test isn’t enough; you need confirmation to increase your probability of success. This can include:
- Volume spikes indicating absorption of orders.
- RSI or MACD divergence signaling weakening momentum against the retracement.
- Price action signals such as pin bars, engulfing candles, or other reversal patterns formed inside or near the FVG zone.
4. Entry Placement:
For bullish FVGs, enter near the bottom boundary of the gap zone, aiming to ride the expected upward bounce. For bearish FVGs, sell near the top edge of the gap, expecting price to reverse downward after filling the gap.
5. Stop-Loss Placement:
Protect your trade by placing the stop-loss just beyond the opposite edge of the FVG zone. This helps avoid being prematurely stopped out by minor price fluctuations outside the gap. The stop-loss distance can also be adjusted based on market volatility.
6. Take-Profit Targets:
Your exit can be placed at the next logical area of liquidity, such as a prior order block, swing high/low, or a key support/resistance level. Another approach is to use a fixed risk-reward ratio like 1:2 or higher to ensure your winning trades outweigh losses over time.
For beginners, understanding the basics of forex trading will also boost your confidence when applying FVG. You can explore our detailed article on What is Forex Trading to strengthen your foundation.
Ideal Timeframes & Confirmations for Trading FVGs
The timeframe you trade FVGs on significantly impacts their reliability and frequency. Consider these if you want to learn how to trade FVG:
- Higher Timeframes (H4, Daily, Weekly):
FVGs on these timeframes tend to be more reliable and signal stronger institutional activity. However, they appear less frequently, making them better suited for swing or position traders who hold trades over several days or weeks. - Lower Timeframes (M15, H1):
On these timeframes, FVGs occur more frequently, offering many opportunities for day traders and scalpers. But because lower timeframes can be noisy and prone to false signals, confirming FVGs with volume, momentum oscillators, and broader market structure is even more critical. - Always combine FVG with Market Structure:
Identify key support and resistance levels, trend direction, and liquidity zones to improve trade accuracy. FVGs inside a strong trend or near a significant order block tend to have higher confluence and success. - Use Volume Confirmation:
Rising volume near the FVG test zone confirms institutional participation, increasing the likelihood of a valid bounce or rejection.

Fair Value Gap vs Other Gaps and Trading Concepts
Understanding how Fair Value Gaps differ from other market gaps and concepts is important for clarity and effective FVG strategy building.
FVG vs Liquidity Gaps
Although the terms sound similar, liquidity gaps and Fair Value Gap indictors serve different purposes:
- Liquidity Gaps generally refer to price areas where liquidity clusters—such as stop-loss orders or pending buy/sell orders—exist. These zones are often just above previous highs or below lows, attracting institutional stops for “stop hunting.”
- Fair Value Gaps (FVGs) specifically describe the three-candle pattern price imbalance caused by rapid institutional order flow. FVGs represent zones where price moved too quickly, skipping a range of value.
|
Feature |
Fair Value Gap (FVG) |
Liquidity Gap |
|
Definition |
Imbalance zone from 3-candle price gap |
Areas with clustered stop/pending orders |
|
Formation |
Created by quick, aggressive moves |
Formed by accumulation of stops/orders |
|
Role in Trading |
Entry/exit zones for retracement trades |
Targets for stop hunting and liquidity grabs |
For more strategies, check out our 10 Best Forex Trading Strategies.
FVG vs Order Blocks
Order blocks are another smart money trading gap tools often discussed alongside FVGs, but they represent different market phenomena:
- Order Blocks are consolidation or base zones where institutions accumulate or distribute large orders before a strong price move. They are typically visible as tight trading ranges or overlapping candles prior to a breakout.
- Fair Value Gap indicators show up after order blocks when price breaks out rapidly, leaving behind a price imbalance or gap.
|
Feature |
Fair Value Gap |
Order Block |
|
Appearance |
Gap between candle ranges |
Consolidation or base zone |
|
Purpose |
Area where price often returns to fill |
Zone of institutional order flow |
|
Usage |
Entry after gap retracement |
Identify supply/demand zones |
Combining these tools provides a powerful way to analyze institutional activity and predict price behavior.
Real Examples of Fair Value Gap Indicators in Action
Filled vs Unfilled Gaps
When monitoring FVGs, one of the key observations is whether the gap gets “filled” or remains “unfilled.”
- Filled Fair Value Gap:
This occurs when price retraces back into the gap zone and tests the area. A filled FVG usually means liquidity was absorbed, and the market found a temporary equilibrium before continuing its move. Filled FVGs often offer good entry points because they confirm the gap’s relevance as a support or resistance zone. - Unfilled Fair Value Gap:
Sometimes price doesn’t return to fill the gap. This often signals strong momentum and trend continuation, suggesting that institutional orders remain aggressive, pushing price forward without revisiting prior zones. While unfilled FVGs show strength, they offer fewer immediate trade entries.

Common Mistakes in FVG Trading
- Trading every gap blindly: Not all gaps get filled; wait for confirmation.
- Ignoring volume & structure: FVG is a tool, not a standalone system.
- Using on very low liquidity assets: FVGs are less reliable in illiquid or choppy markets.
- Poor risk management: Always set stops outside the gap to avoid premature exits.
Final Thoughts: Should You Use FVG in Your Trading?
Fair Value Gaps provide a clear window into institutional price activity and liquidity zones. When combined with other smart money tools—like order blocks, liquidity sweeps, and market structure—they can greatly enhance your trading edge.
However, like any tool, FVG requires practice, patience, and solid risk management. Learn how to trade FVG by demo trading and gradually integrate FVG analysis into your FVG strategy.
If you want to improve your execution speed and trade efficiently, consider What is a Forex VPS and discover the Best Forex VPS Providers. When you’re ready to power your trades, you can Buy Forex VPS from MonoVM for top performance.